Dick's Sporting Goods (DKS) Just Overtook the 200-Day Moving Average
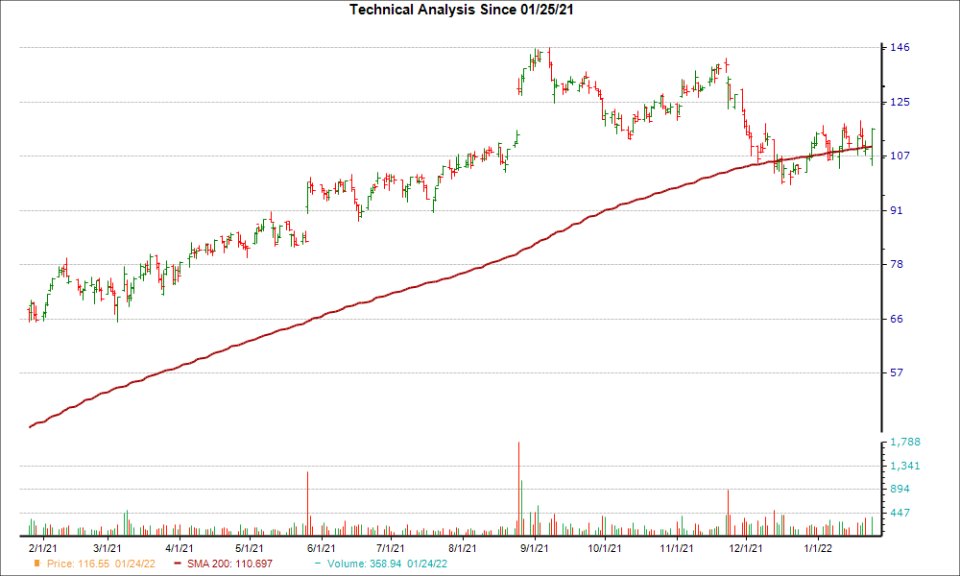
Dick's Sporting Goods (DKS) reached a significant support level, and could be a good pick for investors from a technical perspective. Recently, DKS broke through the 200-day moving average, which suggests a long-term bullish trend.
The 200-day simple moving average is widely-used by traders and analysts, and helps establish market trends for stocks, commodities, indexes, and other financial instruments over the long term. The indicator moves higher or lower together with longer-term price moves, serving as a support or resistance level.
DKS could be on the verge of another rally after moving 8.4% higher over the last four weeks. Plus, the company is currently a Zacks Rank #1 (Strong Buy) stock.
Once investors consider DKS's positive earnings estimate revisions, the bullish case only solidifies. No estimate has gone lower in the past two months for the current fiscal year, compared to 9 higher, and the consensus estimate has increased as well.
With a winning combination of earnings estimate revisions and hitting a key technical level, investors should keep their eye on DKS for more gains in the near future.
Want the latest recommendations from Zacks Investment Research? Today, you can download 7 Best Stocks for the Next 30 Days. Click to get this free report
DICK'S Sporting Goods, Inc. (DKS) : Free Stock Analysis Report
To read this article on Zacks.com click here.
Zacks Investment Research
