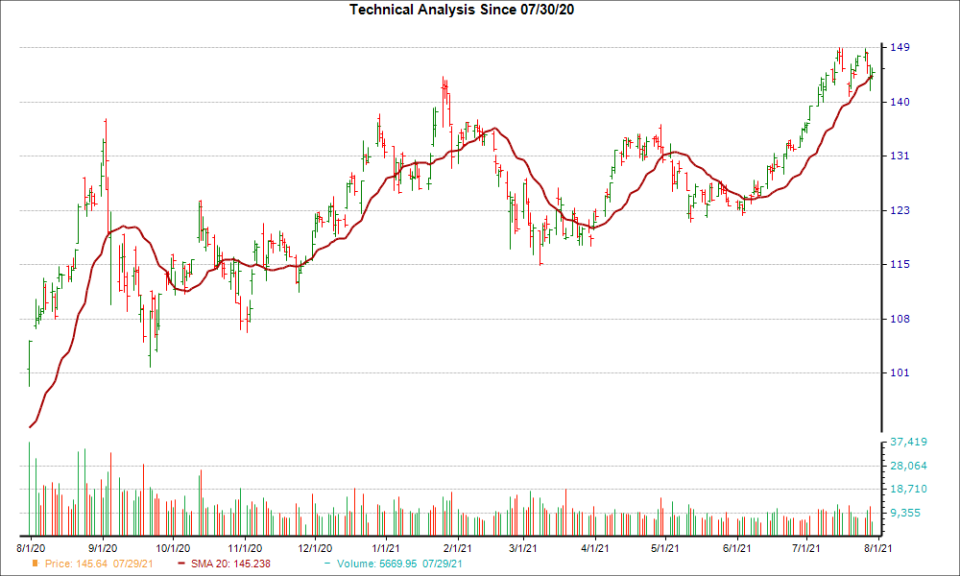
Apple (AAPL) Just Overtook the 20-Day Moving Average
Apple (AAPL) reached a significant support level, and could be a good pick for investors from a technical perspective. Recently, AAPL broke through the 20-day moving average, which suggests a short-term bullish trend.
The 20-day simple moving average is a popular trading tool. It provides a look back at a stock's price over a 20-day period, and is beneficial to short-term traders since it smooths out price fluctuations and provides more trend reversal signals than longer-term moving averages.
Like other SMAs, if a stock's price is moving above the 20-day, the trend is considered positive. When the price falls below the moving average, it can signal a downward trend.
AAPL has rallied 6.1% over the past four weeks, and the company is a Zacks Rank #1 (Strong Buy) at the moment. This combination suggests AAPL could be on the verge of another move higher.
Once investors consider AAPL's positive earnings estimate revisions, the bullish case only solidifies. No earnings estimate has been lowered in the past two months, compared to 10 raised estimates, for the current fiscal year, and the consensus estimate has increased as well.
Investors should think about putting AAPL on their watchlist given the ultra-important technical indicator and positive move in earnings estimate revisions.
Want the latest recommendations from Zacks Investment Research? Today, you can download 7 Best Stocks for the Next 30 Days. Click to get this free report
Apple Inc. (AAPL) : Free Stock Analysis Report
To read this article on Zacks.com click here.
Zacks Investment Research
