How Does Nextedia's (EPA:ALNXT) P/E Compare To Its Industry, After The Share Price Drop?

Unfortunately for some shareholders, the Nextedia (EPA:ALNXT) share price has dived 32% in the last thirty days. That drop has capped off a tough year for shareholders, with the share price down 33% in that time.
All else being equal, a share price drop should make a stock more attractive to potential investors. While the market sentiment towards a stock is very changeable, in the long run, the share price will tend to move in the same direction as earnings per share. So, on certain occasions, long term focussed investors try to take advantage of pessimistic expectations to buy shares at a better price. One way to gauge market expectations of a stock is to look at its Price to Earnings Ratio (PE Ratio). A high P/E implies that investors have high expectations of what a company can achieve compared to a company with a low P/E ratio.
Check out our latest analysis for Nextedia
How Does Nextedia's P/E Ratio Compare To Its Peers?
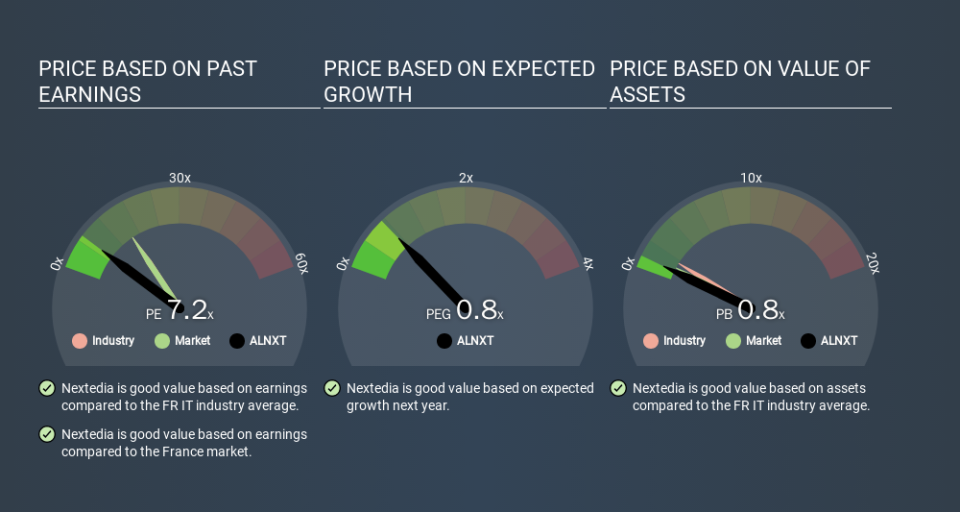
Nextedia's P/E of 7.21 indicates relatively low sentiment towards the stock. If you look at the image below, you can see Nextedia has a lower P/E than the average (14.0) in the it industry classification.
This suggests that market participants think Nextedia will underperform other companies in its industry. While current expectations are low, the stock could be undervalued if the situation is better than the market assumes. You should delve deeper. I like to check if company insiders have been buying or selling.
How Growth Rates Impact P/E Ratios
P/E ratios primarily reflect market expectations around earnings growth rates. That's because companies that grow earnings per share quickly will rapidly increase the 'E' in the equation. That means even if the current P/E is high, it will reduce over time if the share price stays flat. A lower P/E should indicate the stock is cheap relative to others -- and that may attract buyers.
Nextedia increased earnings per share by a whopping 33% last year.
A Limitation: P/E Ratios Ignore Debt and Cash In The Bank
Don't forget that the P/E ratio considers market capitalization. So it won't reflect the advantage of cash, or disadvantage of debt. Theoretically, a business can improve its earnings (and produce a lower P/E in the future) by investing in growth. That means taking on debt (or spending its cash).
Spending on growth might be good or bad a few years later, but the point is that the P/E ratio does not account for the option (or lack thereof).
Nextedia's Balance Sheet
Nextedia has net debt worth just 7.8% of its market capitalization. The market might award it a higher P/E ratio if it had net cash, but its unlikely this low level of net borrowing is having a big impact on the P/E multiple.
The Verdict On Nextedia's P/E Ratio
Nextedia's P/E is 7.2 which is below average (14.2) in the FR market. The EPS growth last year was strong, and debt levels are quite reasonable. If the company can continue to grow earnings, then the current P/E may be unjustifiably low. What can be absolutely certain is that the market has become more pessimistic about Nextedia over the last month, with the P/E ratio falling from 10.5 back then to 7.2 today. For those who prefer invest in growth, this stock apparently offers limited promise, but the deep value investors may find the pessimism around this stock enticing.
Investors should be looking to buy stocks that the market is wrong about. If the reality for a company is not as bad as the P/E ratio indicates, then the share price should increase as the market realizes this. So this free visual report on analyst forecasts could hold the key to an excellent investment decision.
But note: Nextedia may not be the best stock to buy. So take a peek at this free list of interesting companies with strong recent earnings growth (and a P/E ratio below 20).
If you spot an error that warrants correction, please contact the editor at editorial-team@simplywallst.com. This article by Simply Wall St is general in nature. It does not constitute a recommendation to buy or sell any stock, and does not take account of your objectives, or your financial situation. Simply Wall St has no position in the stocks mentioned.
We aim to bring you long-term focused research analysis driven by fundamental data. Note that our analysis may not factor in the latest price-sensitive company announcements or qualitative material. Thank you for reading.
