Could The Gravity Co., Ltd. (NASDAQ:GRVY) Ownership Structure Tell Us Something Useful?
If you want to know who really controls Gravity Co., Ltd. (NASDAQ:GRVY), then you'll have to look at the makeup of its share registry. Large companies usually have institutions as shareholders, and we usually see insiders owning shares in smaller companies. Companies that used to be publicly owned tend to have lower insider ownership.
Gravity is not a large company by global standards. It has a market capitalization of US$637m, which means it wouldn't have the attention of many institutional investors. Taking a look at our data on the ownership groups (below), it seems that institutions own shares in the company. We can zoom in on the different ownership groups, to learn more about Gravity.
Check out our latest analysis for Gravity

What Does The Institutional Ownership Tell Us About Gravity?
Many institutions measure their performance against an index that approximates the local market. So they usually pay more attention to companies that are included in major indices.
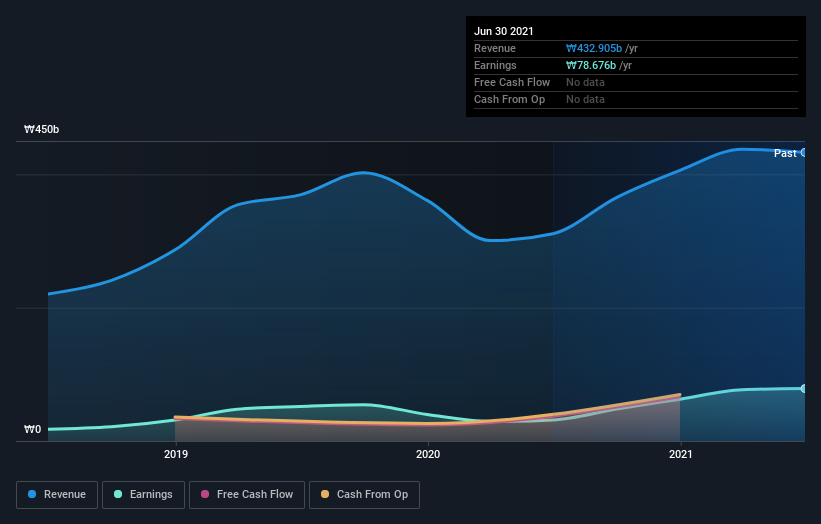
We can see that Gravity does have institutional investors; and they hold a good portion of the company's stock. This suggests some credibility amongst professional investors. But we can't rely on that fact alone since institutions make bad investments sometimes, just like everyone does. If multiple institutions change their view on a stock at the same time, you could see the share price drop fast. It's therefore worth looking at Gravity's earnings history below. Of course, the future is what really matters.
We note that hedge funds don't have a meaningful investment in Gravity. The company's largest shareholder is GungHo Online Entertainment, Inc., with ownership of 59%. This essentially means that they have extensive influence, if not outright control, over the future of the corporation. In comparison, the second and third largest shareholders hold about 3.5% and 0.7% of the stock.
Researching institutional ownership is a good way to gauge and filter a stock's expected performance. The same can be achieved by studying analyst sentiments. Our information suggests that there isn't any analyst coverage of the stock, so it is probably little known.
Insider Ownership Of Gravity
The definition of company insiders can be subjective and does vary between jurisdictions. Our data reflects individual insiders, capturing board members at the very least. Management ultimately answers to the board. However, it is not uncommon for managers to be executive board members, especially if they are a founder or the CEO.
Most consider insider ownership a positive because it can indicate the board is well aligned with other shareholders. However, on some occasions too much power is concentrated within this group.
Our data cannot confirm that board members are holding shares personally. Given we are not picking up on insider ownership, we may have missing data. Therefore, it would be interesting to assess the CEO compensation and tenure, here.
General Public Ownership
With a 31% ownership, the general public have some degree of sway over Gravity. This size of ownership, while considerable, may not be enough to change company policy if the decision is not in sync with other large shareholders.
Public Company Ownership
It appears to us that public companies own 59% of Gravity. This may be a strategic interest and the two companies may have related business interests. It could be that they have de-merged. This holding is probably worth investigating further.
Next Steps:
I find it very interesting to look at who exactly owns a company. But to truly gain insight, we need to consider other information, too.
I like to dive deeper into how a company has performed in the past. You can access this interactive graph of past earnings, revenue and cash flow, for free.
Of course this may not be the best stock to buy. Therefore, you may wish to see our free collection of interesting prospects boasting favorable financials.
NB: Figures in this article are calculated using data from the last twelve months, which refer to the 12-month period ending on the last date of the month the financial statement is dated. This may not be consistent with full year annual report figures.
This article by Simply Wall St is general in nature. We provide commentary based on historical data and analyst forecasts only using an unbiased methodology and our articles are not intended to be financial advice. It does not constitute a recommendation to buy or sell any stock, and does not take account of your objectives, or your financial situation. We aim to bring you long-term focused analysis driven by fundamental data. Note that our analysis may not factor in the latest price-sensitive company announcements or qualitative material. Simply Wall St has no position in any stocks mentioned.
Have feedback on this article? Concerned about the content? Get in touch with us directly. Alternatively, email editorial-team (at) simplywallst.com.
