What Type Of Shareholders Make Up TP ICAP Group PLC's (LON:TCAP) Share Registry?
Every investor in TP ICAP Group PLC (LON:TCAP) should be aware of the most powerful shareholder groups. Generally speaking, as a company grows, institutions will increase their ownership. Conversely, insiders often decrease their ownership over time. Companies that used to be publicly owned tend to have lower insider ownership.
With a market capitalization of UK£1.6b, TP ICAP Group is a decent size, so it is probably on the radar of institutional investors. Taking a look at our data on the ownership groups (below), it seems that institutions own shares in the company. Let's delve deeper into each type of owner, to discover more about TP ICAP Group.
Check out our latest analysis for TP ICAP Group

What Does The Institutional Ownership Tell Us About TP ICAP Group?
Institutions typically measure themselves against a benchmark when reporting to their own investors, so they often become more enthusiastic about a stock once it's included in a major index. We would expect most companies to have some institutions on the register, especially if they are growing.
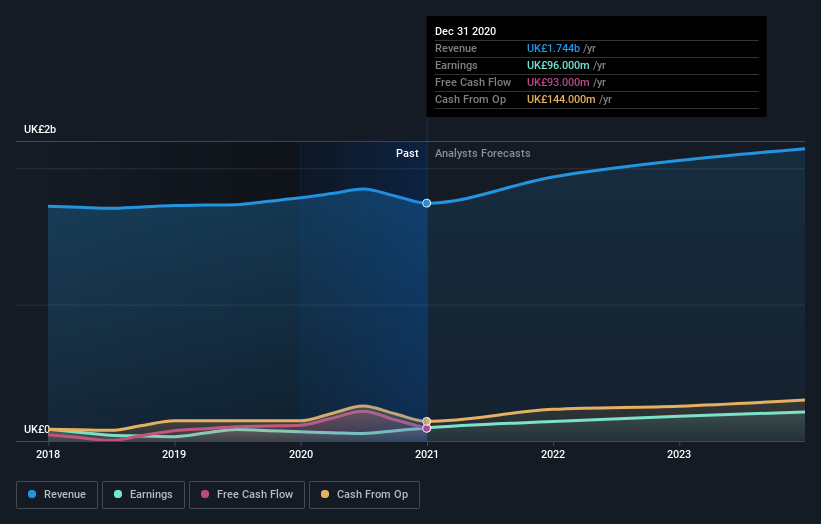
As you can see, institutional investors have a fair amount of stake in TP ICAP Group. This suggests some credibility amongst professional investors. But we can't rely on that fact alone since institutions make bad investments sometimes, just like everyone does. When multiple institutions own a stock, there's always a risk that they are in a 'crowded trade'. When such a trade goes wrong, multiple parties may compete to sell stock fast. This risk is higher in a company without a history of growth. You can see TP ICAP Group's historic earnings and revenue below, but keep in mind there's always more to the story.
Hedge funds don't have many shares in TP ICAP Group. Our data shows that Schroder Investment Management Limited is the largest shareholder with 8.2% of shares outstanding. In comparison, the second and third largest shareholders hold about 6.3% and 4.8% of the stock.
Our studies suggest that the top 25 shareholders collectively control less than half of the company's shares, meaning that the company's shares are widely disseminated and there is no dominant shareholder.
Researching institutional ownership is a good way to gauge and filter a stock's expected performance. The same can be achieved by studying analyst sentiments. Quite a few analysts cover the stock, so you could look into forecast growth quite easily.
Insider Ownership Of TP ICAP Group
The definition of company insiders can be subjective and does vary between jurisdictions. Our data reflects individual insiders, capturing board members at the very least. Company management run the business, but the CEO will answer to the board, even if he or she is a member of it.
Most consider insider ownership a positive because it can indicate the board is well aligned with other shareholders. However, on some occasions too much power is concentrated within this group.
Our most recent data indicates that insiders own less than 1% of TP ICAP Group PLC. It's a big company, so even a small proportional interest can create alignment between the board and shareholders. In this case insiders own UK£1.0m worth of shares. Arguably, recent buying and selling is just as important to consider. You can click here to see if insiders have been buying or selling.
General Public Ownership
The general public collectively holds 58% of TP ICAP Group shares. This level of ownership gives investors from the wider public some power to sway key policy decisions such as board composition, executive compensation, and the dividend payout ratio.
Next Steps:
I find it very interesting to look at who exactly owns a company. But to truly gain insight, we need to consider other information, too. Take risks for example - TP ICAP Group has 5 warning signs (and 1 which is concerning) we think you should know about.
If you would prefer discover what analysts are predicting in terms of future growth, do not miss this free report on analyst forecasts.
NB: Figures in this article are calculated using data from the last twelve months, which refer to the 12-month period ending on the last date of the month the financial statement is dated. This may not be consistent with full year annual report figures.
This article by Simply Wall St is general in nature. It does not constitute a recommendation to buy or sell any stock, and does not take account of your objectives, or your financial situation. We aim to bring you long-term focused analysis driven by fundamental data. Note that our analysis may not factor in the latest price-sensitive company announcements or qualitative material. Simply Wall St has no position in any stocks mentioned.
Have feedback on this article? Concerned about the content? Get in touch with us directly. Alternatively, email editorial-team (at) simplywallst.com.
