Expedia (EXPE) Q2 Earnings & Revenues Beat Estimates, Rise Y/Y
Expedia Group, Inc. EXPE reported adjusted earnings of $1.96 per share in second-quarter 2022, beating the Zacks Consensus Estimate by 24.8%. The figure compares favorably with the loss of $1.13 per share reported in the prior-year quarter.
Revenues of $3.18 billion rose 51% year over year. Further, the figure surpassed the Zacks Consensus Estimate of $3.04 billion.
Year-over-year revenue growth was driven by strong recovery across all the company’s lines of business, owing to the increasing travel resiliency of people. Improved travel demand from the year-ago quarter contributed well.
Notably, the company witnessed travel disruptions during the summer season and faced macroeconomic headwinds in the reported quarter.
Nevertheless, strong recovery across the company’s all lines of business, owing to the increasing travel resiliency of people and improving travel demand, contributed well to the company’s top-line growth.
Expedia’s gross bookings were $26.14 billion, which increased 26% year over year. Improvement in lodging and air bookings contributed well. Also, strong growth in ‘booked room nights’ and ‘stayed room nights’ was a positive.
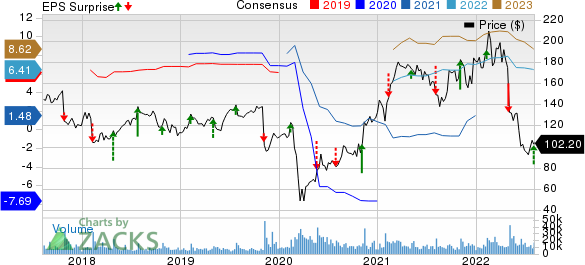
Expedia Group, Inc. Price, Consensus and EPS Surprise
Expedia Group, Inc. price-consensus-eps-surprise-chart | Expedia Group, Inc. Quote
Revenues by Segment
Retail: The company generated $2.42 billion in revenues (76.1% of the total revenues) from the segment, rising 41% year over year.
B2B: The segment yielded revenues of $650 million (20.4% of the total revenues), up 113% from the year-ago quarter.
trivago: Revenues from the segment totaled $154 million (4.8% of the total revenues), up 34% year over year.
Revenues by Business Model
The Merchant model generated revenues of $2.13 billion (66.8% of the total revenues), up 59% year over year. Merchant gross bookings were $13.4 billion, up 28% from the prior-year quarter.
The Agency division generated revenues of $808 million (25.4% of the total revenues), improving 41% from the prior-year quarter. Agency gross bookings were $12.8 billion, up 23% year over year.
Advertising & Media, and Other generated $248 million of revenues (7.8% of the top line), increasing 24% from the year-ago quarter. This can primarily be attributed to the strong performance of Expedia Media Solutions and trivago. Also, the growing momentum across travel insurance and car products contributed well.
Revenues by Geography
Expedia generated $2.21 billion in revenues (69.4% of the total revenues) from domestic regions, up 27% from the prior-year quarter.
Revenues generated from international regions totaled $973 million (30.6% of the total revenues), up 159% on a year-over-year basis.
Revenues by Product Line
Lodging revenues were $2.4 billion, which accounted for 75% of the total revenues. The company witnessed 57% growth in Lodging revenues, owing to the solid momentum in stayed room nights, which grew 40%. Also, 21% growth in booked room nights contributed well. The company witnessed a 12% rise in revenues per room night.
Air revenues were $95 million, which accounted for 3% of the total revenues. Notably, the company witnessed a 22% rise in Air revenues, owing to growth of 21% in revenue per ticket and 35% in airfare.
Operating Details
Adjusted EBITDA was $648 million in the reported quarter compared with $201 million in the year-ago quarter.
Adjusted selling and marketing expenses were $1.7 billion, up 46% year over year. As a percentage of revenues, the figure contracted 187 basis points (bps) year over year.
Adjusted general and administrative expenses were $143 million, up 7% year over year. The figure contracted 185 bps year over year as a percentage of revenues.
Adjusted technology and content expenses were $257 million, up 5% from the year-ago quarter. The figure contracted 351 bps from the year-ago quarter as a percentage of revenues.
The company reported a second-quarter operating income of $345 million compared with a loss of $132 million in the year-ago quarter.
Balance Sheet & Cash Flow
As of Jun 30, 2022, cash and cash equivalents were $5.6 billion, up from $5.5 billion as of Mar 31, 2022. Short-term investments were $26 million at the end of the reported quarter. Notably, short-term investments were nil in the prior quarter.
Long-term debt was $6.7 billion at the end of the second quarter compared with $7.7 billion at the end of the first quarter.
Expedia generated $1.6 billion of cash from operations in the quarter under review compared with $3 billion in the last reported quarter.
Free cash flow was $1.5 billion in the second quarter.
Zacks Rank & Stocks to Consider
Currently, Expedia carries a Zacks Rank #3 (Hold).
Some better-ranked stocks in the retail-wholesale sector are Dollar General DG, Costco Wholesale COST and Dollar Tree DLTR, each currently carrying a Zacks Rank #2 (Buy). You can see the complete list of today’s Zacks #1 Rank (Strong Buy) stocks here.
Dollar General has gained 6.8% on a year-to-date basis. The long-term earnings growth rate for the DG stock is currently projected at 12.2%.
Costco Wholesale has lost 3.6% on a year-to-date basis. The long-term earnings growth rate for the COST stock is currently projected at 9.2%.
Dollar Tree has returned 17.5% on a year-to-date basis. The long-term earnings growth rate for the DLTR stock is currently projected at 15.5%.
Want the latest recommendations from Zacks Investment Research? Today, you can download 7 Best Stocks for the Next 30 Days. Click to get this free report
Dollar General Corporation (DG) : Free Stock Analysis Report
Dollar Tree, Inc. (DLTR) : Free Stock Analysis Report
Expedia Group, Inc. (EXPE) : Free Stock Analysis Report
Costco Wholesale Corporation (COST) : Free Stock Analysis Report
To read this article on Zacks.com click here.
Zacks Investment Research
