What Kind Of Investors Own Most Of NEXTDC Limited (ASX:NXT)?
A look at the shareholders of NEXTDC Limited (ASX:NXT) can tell us which group is most powerful. Generally speaking, as a company grows, institutions will increase their ownership. Conversely, insiders often decrease their ownership over time. Companies that have been privatized tend to have low insider ownership.
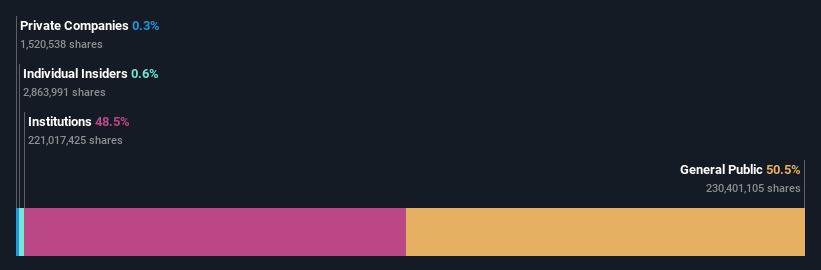
NEXTDC is a pretty big company. It has a market capitalization of AU$5.5b. Normally institutions would own a significant portion of a company this size. Taking a look at our data on the ownership groups (below), it seems that institutional investors have bought into the company. Let's take a closer look to see what the different types of shareholders can tell us about NEXTDC.
View our latest analysis for NEXTDC
What Does The Institutional Ownership Tell Us About NEXTDC?
Many institutions measure their performance against an index that approximates the local market. So they usually pay more attention to companies that are included in major indices.
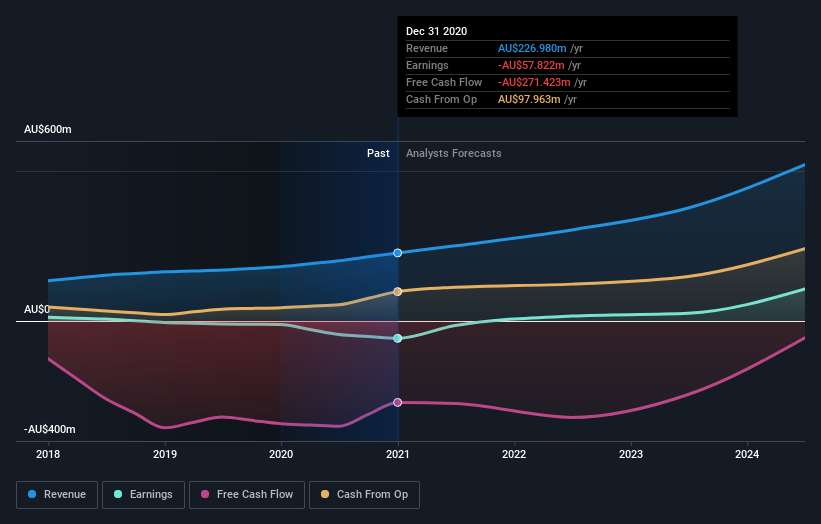
We can see that NEXTDC does have institutional investors; and they hold a good portion of the company's stock. This can indicate that the company has a certain degree of credibility in the investment community. However, it is best to be wary of relying on the supposed validation that comes with institutional investors. They too, get it wrong sometimes. When multiple institutions own a stock, there's always a risk that they are in a 'crowded trade'. When such a trade goes wrong, multiple parties may compete to sell stock fast. This risk is higher in a company without a history of growth. You can see NEXTDC's historic earnings and revenue below, but keep in mind there's always more to the story.
NEXTDC is not owned by hedge funds. Our data shows that UniSuper Limited is the largest shareholder with 6.2% of shares outstanding. With 4.6% and 3.6% of the shares outstanding respectively, Ellerston Capital Limited and Yarra Funds Management Limited are the second and third largest shareholders.
On studying our ownership data, we found that 25 of the top shareholders collectively own less than 50% of the share register, implying that no single individual has a majority interest.
While it makes sense to study institutional ownership data for a company, it also makes sense to study analyst sentiments to know which way the wind is blowing. There are a reasonable number of analysts covering the stock, so it might be useful to find out their aggregate view on the future.
Insider Ownership Of NEXTDC
The definition of company insiders can be subjective and does vary between jurisdictions. Our data reflects individual insiders, capturing board members at the very least. Company management run the business, but the CEO will answer to the board, even if he or she is a member of it.
I generally consider insider ownership to be a good thing. However, on some occasions it makes it more difficult for other shareholders to hold the board accountable for decisions.
Our most recent data indicates that insiders own less than 1% of NEXTDC Limited. It is a pretty big company, so it would be possible for board members to own a meaningful interest in the company, without owning much of a proportional interest. In this case, they own around AU$34m worth of shares (at current prices). It is always good to see at least some insider ownership, but it might be worth checking if those insiders have been selling.
General Public Ownership
The general public -- including retail investors -- own 51% of NEXTDC. With this amount of ownership, retail investors can collectively play a role in decisions that affect shareholder returns, such as dividend policies and the appointment of directors. They can also exercise the power to vote on acquisitions or mergers that may not improve profitability.
Next Steps:
While it is well worth considering the different groups that own a company, there are other factors that are even more important.
I always like to check for a history of revenue growth. You can too, by accessing this free chart of historic revenue and earnings in this detailed graph.
If you are like me, you may want to think about whether this company will grow or shrink. Luckily, you can check this free report showing analyst forecasts for its future.
NB: Figures in this article are calculated using data from the last twelve months, which refer to the 12-month period ending on the last date of the month the financial statement is dated. This may not be consistent with full year annual report figures.
This article by Simply Wall St is general in nature. It does not constitute a recommendation to buy or sell any stock, and does not take account of your objectives, or your financial situation. We aim to bring you long-term focused analysis driven by fundamental data. Note that our analysis may not factor in the latest price-sensitive company announcements or qualitative material. Simply Wall St has no position in any stocks mentioned.
Have feedback on this article? Concerned about the content? Get in touch with us directly. Alternatively, email editorial-team (at) simplywallst.com.
