Calculating The Intrinsic Value Of init innovation in traffic systems SE (ETR:IXX)
Key Insights
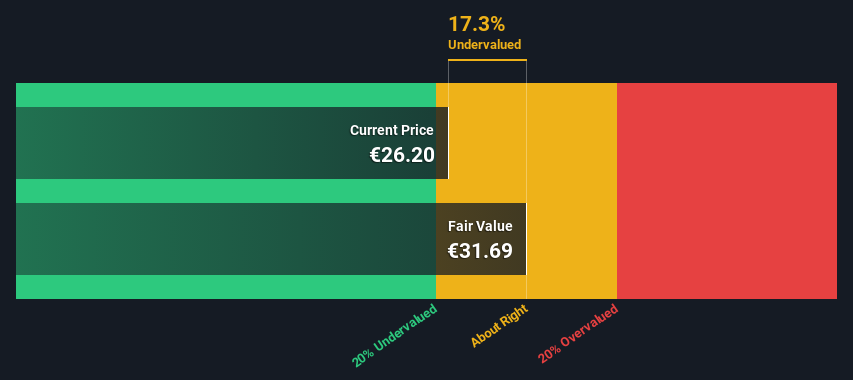
The projected fair value for init innovation in traffic systems is €31.69 based on 2 Stage Free Cash Flow to Equity
Current share price of €26.20 suggests init innovation in traffic systems is potentially trading close to its fair value
Does the October share price for init innovation in traffic systems SE (ETR:IXX) reflect what it's really worth? Today, we will estimate the stock's intrinsic value by taking the expected future cash flows and discounting them to their present value. The Discounted Cash Flow (DCF) model is the tool we will apply to do this. Models like these may appear beyond the comprehension of a lay person, but they're fairly easy to follow.
We would caution that there are many ways of valuing a company and, like the DCF, each technique has advantages and disadvantages in certain scenarios. Anyone interested in learning a bit more about intrinsic value should have a read of the Simply Wall St analysis model.
Check out our latest analysis for init innovation in traffic systems
Crunching The Numbers
We're using the 2-stage growth model, which simply means we take in account two stages of company's growth. In the initial period the company may have a higher growth rate and the second stage is usually assumed to have a stable growth rate. To start off with, we need to estimate the next ten years of cash flows. Where possible we use analyst estimates, but when these aren't available we extrapolate the previous free cash flow (FCF) from the last estimate or reported value. We assume companies with shrinking free cash flow will slow their rate of shrinkage, and that companies with growing free cash flow will see their growth rate slow, over this period. We do this to reflect that growth tends to slow more in the early years than it does in later years.
Generally we assume that a dollar today is more valuable than a dollar in the future, and so the sum of these future cash flows is then discounted to today's value:
10-year free cash flow (FCF) estimate
2024 | 2025 | 2026 | 2027 | 2028 | 2029 | 2030 | 2031 | 2032 | 2033 | |
Levered FCF (€, Millions) | €13.3m | €10.2m | €16.9m | €17.3m | €17.6m | €17.8m | €18.0m | €18.1m | €18.2m | €18.3m |
Growth Rate Estimate Source | Analyst x1 | Analyst x1 | Analyst x1 | Analyst x1 | Est @ 1.61% | Est @ 1.23% | Est @ 0.97% | Est @ 0.78% | Est @ 0.65% | Est @ 0.56% |
Present Value (€, Millions) Discounted @ 5.8% | €12.6 | €9.1 | €14.3 | €13.8 | €13.3 | €12.7 | €12.1 | €11.5 | €11.0 | €10.4 |
("Est" = FCF growth rate estimated by Simply Wall St)
Present Value of 10-year Cash Flow (PVCF) = €121m
The second stage is also known as Terminal Value, this is the business's cash flow after the first stage. For a number of reasons a very conservative growth rate is used that cannot exceed that of a country's GDP growth. In this case we have used the 5-year average of the 10-year government bond yield (0.4%) to estimate future growth. In the same way as with the 10-year 'growth' period, we discount future cash flows to today's value, using a cost of equity of 5.8%.
Terminal Value (TV)= FCF2033 × (1 + g) ÷ (r – g) = €18m× (1 + 0.4%) ÷ (5.8%– 0.4%) = €338m
Present Value of Terminal Value (PVTV)= TV / (1 + r)10= €338m÷ ( 1 + 5.8%)10= €192m
The total value is the sum of cash flows for the next ten years plus the discounted terminal value, which results in the Total Equity Value, which in this case is €313m. The last step is to then divide the equity value by the number of shares outstanding. Relative to the current share price of €26.2, the company appears about fair value at a 17% discount to where the stock price trades currently. The assumptions in any calculation have a big impact on the valuation, so it is better to view this as a rough estimate, not precise down to the last cent.
The Assumptions
The calculation above is very dependent on two assumptions. The first is the discount rate and the other is the cash flows. If you don't agree with these result, have a go at the calculation yourself and play with the assumptions. The DCF also does not consider the possible cyclicality of an industry, or a company's future capital requirements, so it does not give a full picture of a company's potential performance. Given that we are looking at init innovation in traffic systems as potential shareholders, the cost of equity is used as the discount rate, rather than the cost of capital (or weighted average cost of capital, WACC) which accounts for debt. In this calculation we've used 5.8%, which is based on a levered beta of 1.089. Beta is a measure of a stock's volatility, compared to the market as a whole. We get our beta from the industry average beta of globally comparable companies, with an imposed limit between 0.8 and 2.0, which is a reasonable range for a stable business.
SWOT Analysis for init innovation in traffic systems
Strength
Earnings growth over the past year exceeded the industry.
Debt is not viewed as a risk.
Dividends are covered by earnings and cash flows.
Weakness
Dividend is low compared to the top 25% of dividend payers in the Software market.
Opportunity
Annual earnings are forecast to grow faster than the German market.
Good value based on P/E ratio and estimated fair value.
Threat
No apparent threats visible for IXX.
Next Steps:
Whilst important, the DCF calculation shouldn't be the only metric you look at when researching a company. DCF models are not the be-all and end-all of investment valuation. Preferably you'd apply different cases and assumptions and see how they would impact the company's valuation. If a company grows at a different rate, or if its cost of equity or risk free rate changes sharply, the output can look very different. For init innovation in traffic systems, there are three additional elements you should look at:
Risks: We feel that you should assess the 1 warning sign for init innovation in traffic systems we've flagged before making an investment in the company.
Future Earnings: How does IXX's growth rate compare to its peers and the wider market? Dig deeper into the analyst consensus number for the upcoming years by interacting with our free analyst growth expectation chart.
Other Solid Businesses: Low debt, high returns on equity and good past performance are fundamental to a strong business. Why not explore our interactive list of stocks with solid business fundamentals to see if there are other companies you may not have considered!
PS. Simply Wall St updates its DCF calculation for every German stock every day, so if you want to find the intrinsic value of any other stock just search here.
Have feedback on this article? Concerned about the content? Get in touch with us directly. Alternatively, email editorial-team (at) simplywallst.com.
This article by Simply Wall St is general in nature. We provide commentary based on historical data and analyst forecasts only using an unbiased methodology and our articles are not intended to be financial advice. It does not constitute a recommendation to buy or sell any stock, and does not take account of your objectives, or your financial situation. We aim to bring you long-term focused analysis driven by fundamental data. Note that our analysis may not factor in the latest price-sensitive company announcements or qualitative material. Simply Wall St has no position in any stocks mentioned.
