We Think Johns Lyng Group (ASX:JLG) Can Manage Its Debt With Ease
Legendary fund manager Li Lu (who Charlie Munger backed) once said, 'The biggest investment risk is not the volatility of prices, but whether you will suffer a permanent loss of capital.' When we think about how risky a company is, we always like to look at its use of debt, since debt overload can lead to ruin. Importantly, Johns Lyng Group Limited (ASX:JLG) does carry debt. But the real question is whether this debt is making the company risky.
Why Does Debt Bring Risk?
Debt and other liabilities become risky for a business when it cannot easily fulfill those obligations, either with free cash flow or by raising capital at an attractive price. In the worst case scenario, a company can go bankrupt if it cannot pay its creditors. However, a more frequent (but still costly) occurrence is where a company must issue shares at bargain-basement prices, permanently diluting shareholders, just to shore up its balance sheet. Having said that, the most common situation is where a company manages its debt reasonably well - and to its own advantage. The first step when considering a company's debt levels is to consider its cash and debt together.
See our latest analysis for Johns Lyng Group
What Is Johns Lyng Group's Debt?
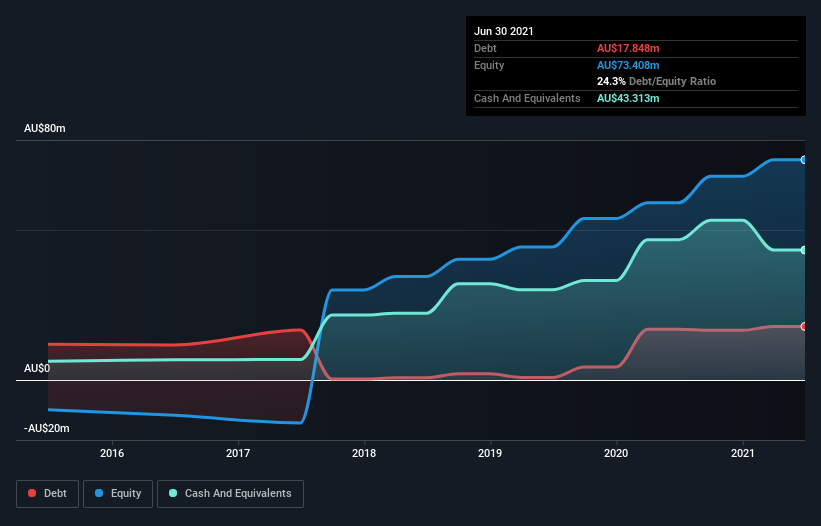
The image below, which you can click on for greater detail, shows that at June 2021 Johns Lyng Group had debt of AU$17.8m, up from AU$16.9m in one year. But on the other hand it also has AU$43.3m in cash, leading to a AU$25.5m net cash position.
How Healthy Is Johns Lyng Group's Balance Sheet?
Zooming in on the latest balance sheet data, we can see that Johns Lyng Group had liabilities of AU$147.7m due within 12 months and liabilities of AU$27.2m due beyond that. Offsetting this, it had AU$43.3m in cash and AU$119.5m in receivables that were due within 12 months. So it has liabilities totalling AU$12.1m more than its cash and near-term receivables, combined.
Having regard to Johns Lyng Group's size, it seems that its liquid assets are well balanced with its total liabilities. So it's very unlikely that the AU$1.35b company is short on cash, but still worth keeping an eye on the balance sheet. While it does have liabilities worth noting, Johns Lyng Group also has more cash than debt, so we're pretty confident it can manage its debt safely.
On top of that, Johns Lyng Group grew its EBIT by 32% over the last twelve months, and that growth will make it easier to handle its debt. The balance sheet is clearly the area to focus on when you are analysing debt. But it is future earnings, more than anything, that will determine Johns Lyng Group's ability to maintain a healthy balance sheet going forward. So if you want to see what the professionals think, you might find this free report on analyst profit forecasts to be interesting.
Finally, a business needs free cash flow to pay off debt; accounting profits just don't cut it. While Johns Lyng Group has net cash on its balance sheet, it's still worth taking a look at its ability to convert earnings before interest and tax (EBIT) to free cash flow, to help us understand how quickly it is building (or eroding) that cash balance. Over the last three years, Johns Lyng Group recorded free cash flow worth a fulsome 99% of its EBIT, which is stronger than we'd usually expect. That puts it in a very strong position to pay down debt.
Summing up
While it is always sensible to look at a company's total liabilities, it is very reassuring that Johns Lyng Group has AU$25.5m in net cash. The cherry on top was that in converted 99% of that EBIT to free cash flow, bringing in AU$26m. So is Johns Lyng Group's debt a risk? It doesn't seem so to us. There's no doubt that we learn most about debt from the balance sheet. However, not all investment risk resides within the balance sheet - far from it. For example, we've discovered 2 warning signs for Johns Lyng Group that you should be aware of before investing here.
At the end of the day, it's often better to focus on companies that are free from net debt. You can access our special list of such companies (all with a track record of profit growth). It's free.
This article by Simply Wall St is general in nature. We provide commentary based on historical data and analyst forecasts only using an unbiased methodology and our articles are not intended to be financial advice. It does not constitute a recommendation to buy or sell any stock, and does not take account of your objectives, or your financial situation. We aim to bring you long-term focused analysis driven by fundamental data. Note that our analysis may not factor in the latest price-sensitive company announcements or qualitative material. Simply Wall St has no position in any stocks mentioned.
Have feedback on this article? Concerned about the content? Get in touch with us directly. Alternatively, email editorial-team (at) simplywallst.com.
