Why You Should Care About HMS Bergbau AG’s (ETR:HMU) Low Return On Capital

Today we are going to look at HMS Bergbau AG (ETR:HMU) to see whether it might be an attractive investment prospect. Specifically, we'll consider its Return On Capital Employed (ROCE), since that will give us an insight into how efficiently the business can generate profits from the capital it requires.
First, we'll go over how we calculate ROCE. Next, we'll compare it to others in its industry. Finally, we'll look at how its current liabilities affect its ROCE.
What is Return On Capital Employed (ROCE)?
ROCE measures the 'return' (pre-tax profit) a company generates from capital employed in its business. Generally speaking a higher ROCE is better. Overall, it is a valuable metric that has its flaws. Author Edwin Whiting says to be careful when comparing the ROCE of different businesses, since 'No two businesses are exactly alike.
How Do You Calculate Return On Capital Employed?
The formula for calculating the return on capital employed is:
Return on Capital Employed = Earnings Before Interest and Tax (EBIT) ÷ (Total Assets - Current Liabilities)
Or for HMS Bergbau:
0.027 = €484k ÷ (€47m - €29m) (Based on the trailing twelve months to June 2019.)
Therefore, HMS Bergbau has an ROCE of 2.7%.
See our latest analysis for HMS Bergbau
Is HMS Bergbau's ROCE Good?
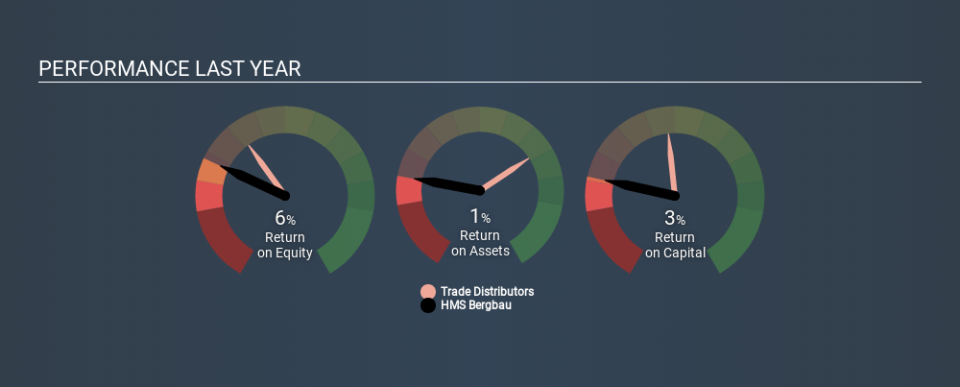
When making comparisons between similar businesses, investors may find ROCE useful. In this analysis, HMS Bergbau's ROCE appears meaningfully below the 11% average reported by the Trade Distributors industry. This performance is not ideal, as it suggests the company may not be deploying its capital as effectively as some competitors. Independently of how HMS Bergbau compares to its industry, its ROCE in absolute terms is low; especially compared to the ~0.2% available in government bonds. There are potentially more appealing investments elsewhere.
HMS Bergbau's current ROCE of 2.7% is lower than its ROCE in the past, which was 11%, 3 years ago. Therefore we wonder if the company is facing new headwinds. You can click on the image below to see (in greater detail) how HMS Bergbau's past growth compares to other companies.
When considering this metric, keep in mind that it is backwards looking, and not necessarily predictive. ROCE can be misleading for companies in cyclical industries, with returns looking impressive during the boom times, but very weak during the busts. ROCE is, after all, simply a snap shot of a single year. If HMS Bergbau is cyclical, it could make sense to check out this free graph of past earnings, revenue and cash flow.
How HMS Bergbau's Current Liabilities Impact Its ROCE
Short term (or current) liabilities, are things like supplier invoices, overdrafts, or tax bills that need to be paid within 12 months. The ROCE equation subtracts current liabilities from capital employed, so a company with a lot of current liabilities appears to have less capital employed, and a higher ROCE than otherwise. To counter this, investors can check if a company has high current liabilities relative to total assets.
HMS Bergbau has total assets of €47m and current liabilities of €29m. Therefore its current liabilities are equivalent to approximately 62% of its total assets. This is a fairly high level of current liabilities, boosting HMS Bergbau's ROCE.
Our Take On HMS Bergbau's ROCE
HMS Bergbau's ROCE in absolute terms is poor, and there are likely better investment prospects out there. But note: make sure you look for a great company, not just the first idea you come across. So take a peek at this free list of interesting companies with strong recent earnings growth (and a P/E ratio below 20).
For those who like to find winning investments this free list of growing companies with recent insider purchasing, could be just the ticket.
Love or hate this article? Concerned about the content? Get in touch with us directly. Alternatively, email editorial-team@simplywallst.com.
This article by Simply Wall St is general in nature. It does not constitute a recommendation to buy or sell any stock, and does not take account of your objectives, or your financial situation. We aim to bring you long-term focused analysis driven by fundamental data. Note that our analysis may not factor in the latest price-sensitive company announcements or qualitative material. Simply Wall St has no position in any stocks mentioned. Thank you for reading.
