Johns Lyng Group's (ASX:JLG) Returns On Capital Not Reflecting Well On The Business
Did you know there are some financial metrics that can provide clues of a potential multi-bagger? Firstly, we'll want to see a proven return on capital employed (ROCE) that is increasing, and secondly, an expanding base of capital employed. This shows us that it's a compounding machine, able to continually reinvest its earnings back into the business and generate higher returns. Having said that, while the ROCE is currently high for Johns Lyng Group (ASX:JLG), we aren't jumping out of our chairs because returns are decreasing.
What is Return On Capital Employed (ROCE)?
If you haven't worked with ROCE before, it measures the 'return' (pre-tax profit) a company generates from capital employed in its business. The formula for this calculation on Johns Lyng Group is:
Return on Capital Employed = Earnings Before Interest and Tax (EBIT) ÷ (Total Assets - Current Liabilities)
0.43 = AU$43m ÷ (AU$248m - AU$148m) (Based on the trailing twelve months to June 2021).
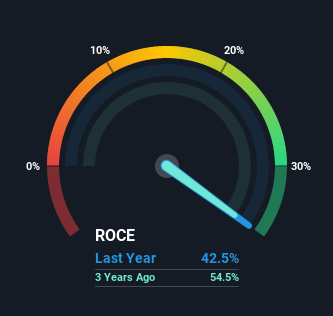
So, Johns Lyng Group has an ROCE of 43%. In absolute terms that's a great return and it's even better than the Construction industry average of 12%.
See our latest analysis for Johns Lyng Group
Above you can see how the current ROCE for Johns Lyng Group compares to its prior returns on capital, but there's only so much you can tell from the past. If you'd like to see what analysts are forecasting going forward, you should check out our free report for Johns Lyng Group.
What The Trend Of ROCE Can Tell Us
In terms of Johns Lyng Group's historical ROCE movements, the trend isn't fantastic. While it's comforting that the ROCE is high, three years ago it was 55%. Although, given both revenue and the amount of assets employed in the business have increased, it could suggest the company is investing in growth, and the extra capital has led to a short-term reduction in ROCE. If these investments prove successful, this can bode very well for long term stock performance.
On a side note, Johns Lyng Group's current liabilities are still rather high at 59% of total assets. This can bring about some risks because the company is basically operating with a rather large reliance on its suppliers or other sorts of short-term creditors. While it's not necessarily a bad thing, it can be beneficial if this ratio is lower.
The Bottom Line
While returns have fallen for Johns Lyng Group in recent times, we're encouraged to see that sales are growing and that the business is reinvesting in its operations. And long term investors must be optimistic going forward because the stock has returned a huge 619% to shareholders in the last three years. So while the underlying trends could already be accounted for by investors, we still think this stock is worth looking into further.
If you'd like to know about the risks facing Johns Lyng Group, we've discovered 2 warning signs that you should be aware of.
Johns Lyng Group is not the only stock earning high returns. If you'd like to see more, check out our free list of companies earning high returns on equity with solid fundamentals.
This article by Simply Wall St is general in nature. We provide commentary based on historical data and analyst forecasts only using an unbiased methodology and our articles are not intended to be financial advice. It does not constitute a recommendation to buy or sell any stock, and does not take account of your objectives, or your financial situation. We aim to bring you long-term focused analysis driven by fundamental data. Note that our analysis may not factor in the latest price-sensitive company announcements or qualitative material. Simply Wall St has no position in any stocks mentioned.
Have feedback on this article? Concerned about the content? Get in touch with us directly. Alternatively, email editorial-team (at) simplywallst.com.
