These 4 Measures Indicate That Viva Energy Group (ASX:VEA) Is Using Debt Extensively
Legendary fund manager Li Lu (who Charlie Munger backed) once said, 'The biggest investment risk is not the volatility of prices, but whether you will suffer a permanent loss of capital.' So it might be obvious that you need to consider debt, when you think about how risky any given stock is, because too much debt can sink a company. As with many other companies Viva Energy Group Limited (ASX:VEA) makes use of debt. But the real question is whether this debt is making the company risky.
When Is Debt A Problem?
Debt is a tool to help businesses grow, but if a business is incapable of paying off its lenders, then it exists at their mercy. In the worst case scenario, a company can go bankrupt if it cannot pay its creditors. While that is not too common, we often do see indebted companies permanently diluting shareholders because lenders force them to raise capital at a distressed price. Having said that, the most common situation is where a company manages its debt reasonably well - and to its own advantage. The first step when considering a company's debt levels is to consider its cash and debt together.
See our latest analysis for Viva Energy Group
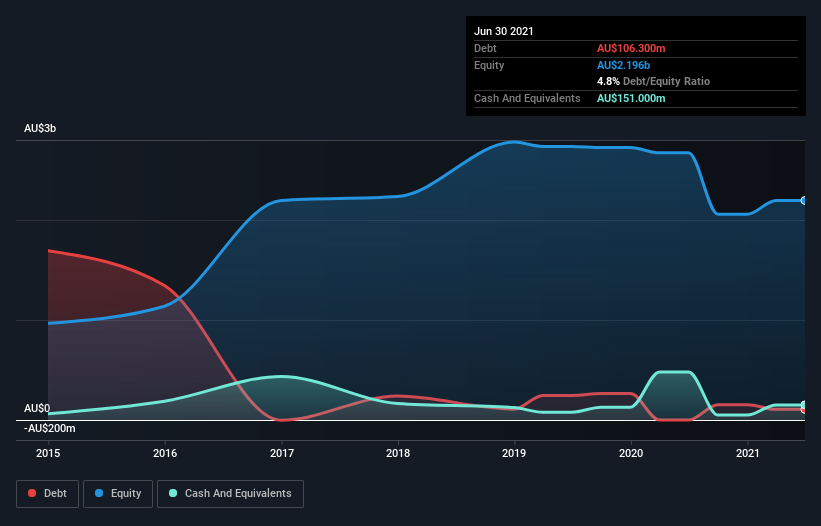
How Much Debt Does Viva Energy Group Carry?
The image below, which you can click on for greater detail, shows that at June 2021 Viva Energy Group had debt of AU$106.3m, up from none in one year. However, its balance sheet shows it holds AU$151.0m in cash, so it actually has AU$44.7m net cash.
A Look At Viva Energy Group's Liabilities
According to the last reported balance sheet, Viva Energy Group had liabilities of AU$2.36b due within 12 months, and liabilities of AU$2.69b due beyond 12 months. On the other hand, it had cash of AU$151.0m and AU$1.22b worth of receivables due within a year. So its liabilities total AU$3.69b more than the combination of its cash and short-term receivables.
When you consider that this deficiency exceeds the company's AU$3.60b market capitalization, you might well be inclined to review the balance sheet intently. Hypothetically, extremely heavy dilution would be required if the company were forced to pay down its liabilities by raising capital at the current share price. Given that Viva Energy Group has more cash than debt, we're pretty confident it can handle its debt, despite the fact that it has a lot of liabilities in total.
We also note that Viva Energy Group improved its EBIT from a last year's loss to a positive AU$571m. There's no doubt that we learn most about debt from the balance sheet. But it is future earnings, more than anything, that will determine Viva Energy Group's ability to maintain a healthy balance sheet going forward. So if you're focused on the future you can check out this free report showing analyst profit forecasts.
Finally, a business needs free cash flow to pay off debt; accounting profits just don't cut it. While Viva Energy Group has net cash on its balance sheet, it's still worth taking a look at its ability to convert earnings before interest and tax (EBIT) to free cash flow, to help us understand how quickly it is building (or eroding) that cash balance. Looking at the most recent year, Viva Energy Group recorded free cash flow of 47% of its EBIT, which is weaker than we'd expect. That weak cash conversion makes it more difficult to handle indebtedness.
Summing up
While Viva Energy Group does have more liabilities than liquid assets, it also has net cash of AU$44.7m. So although we see some areas for improvement, we're not too worried about Viva Energy Group's balance sheet. The balance sheet is clearly the area to focus on when you are analysing debt. But ultimately, every company can contain risks that exist outside of the balance sheet. Case in point: We've spotted 3 warning signs for Viva Energy Group you should be aware of.
If, after all that, you're more interested in a fast growing company with a rock-solid balance sheet, then check out our list of net cash growth stocks without delay.
This article by Simply Wall St is general in nature. We provide commentary based on historical data and analyst forecasts only using an unbiased methodology and our articles are not intended to be financial advice. It does not constitute a recommendation to buy or sell any stock, and does not take account of your objectives, or your financial situation. We aim to bring you long-term focused analysis driven by fundamental data. Note that our analysis may not factor in the latest price-sensitive company announcements or qualitative material. Simply Wall St has no position in any stocks mentioned.
Have feedback on this article? Concerned about the content? Get in touch with us directly. Alternatively, email editorial-team (at) simplywallst.com.
