What Does Téléverbier SA's (EPA:TVRB) P/E Ratio Tell You?

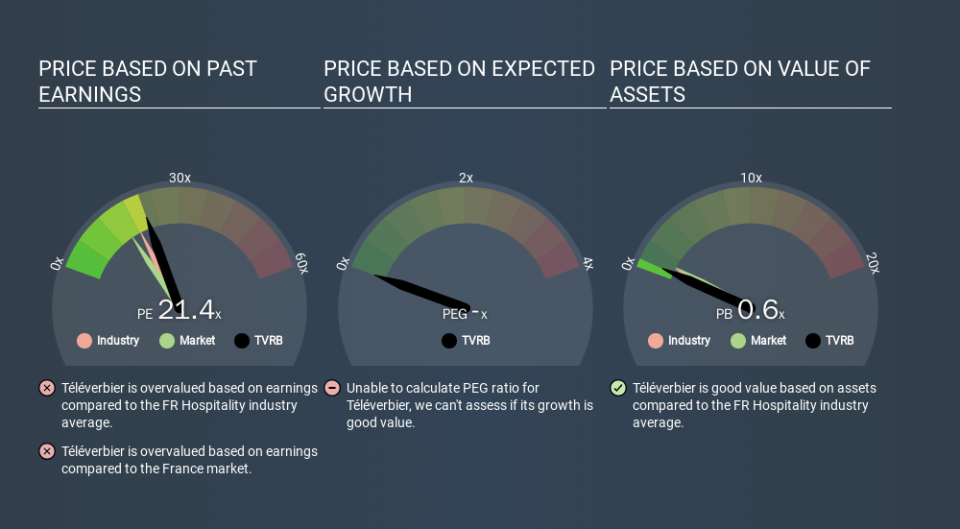
The goal of this article is to teach you how to use price to earnings ratios (P/E ratios). To keep it practical, we'll show how Téléverbier SA's (EPA:TVRB) P/E ratio could help you assess the value on offer. Looking at earnings over the last twelve months, Téléverbier has a P/E ratio of 21.44. In other words, at today's prices, investors are paying €21.44 for every €1 in prior year profit.
View our latest analysis for Téléverbier
How Do I Calculate A Price To Earnings Ratio?
The formula for P/E is:
Price to Earnings Ratio = Share Price (in reporting currency) ÷ Earnings per Share (EPS)
Or for Téléverbier:
P/E of 21.44 = CHF52.744 ÷ CHF2.460 (Based on the trailing twelve months to October 2019.)
(Note: the above calculation uses the share price in the reporting currency, namely CHF and the calculation results may not be precise due to rounding.)
Is A High Price-to-Earnings Ratio Good?
The higher the P/E ratio, the higher the price tag of a business, relative to its trailing earnings. That is not a good or a bad thing per se, but a high P/E does imply buyers are optimistic about the future.
Does Téléverbier Have A Relatively High Or Low P/E For Its Industry?
One good way to get a quick read on what market participants expect of a company is to look at its P/E ratio. As you can see below, Téléverbier has a higher P/E than the average company (18.4) in the hospitality industry.
That means that the market expects Téléverbier will outperform other companies in its industry. Clearly the market expects growth, but it isn't guaranteed. So investors should always consider the P/E ratio alongside other factors, such as whether company directors have been buying shares.
How Growth Rates Impact P/E Ratios
P/E ratios primarily reflect market expectations around earnings growth rates. That's because companies that grow earnings per share quickly will rapidly increase the 'E' in the equation. That means even if the current P/E is high, it will reduce over time if the share price stays flat. And as that P/E ratio drops, the company will look cheap, unless its share price increases.
Téléverbier's earnings made like a rocket, taking off 174% last year. Even better, EPS is up 172% per year over three years. So you might say it really deserves to have an above-average P/E ratio.
A Limitation: P/E Ratios Ignore Debt and Cash In The Bank
The 'Price' in P/E reflects the market capitalization of the company. Thus, the metric does not reflect cash or debt held by the company. The exact same company would hypothetically deserve a higher P/E ratio if it had a strong balance sheet, than if it had a weak one with lots of debt, because a cashed up company can spend on growth.
While growth expenditure doesn't always pay off, the point is that it is a good option to have; but one that the P/E ratio ignores.
So What Does Téléverbier's Balance Sheet Tell Us?
Téléverbier has net cash of CHF14m. This is fairly high at 19% of its market capitalization. That might mean balance sheet strength is important to the business, but should also help push the P/E a bit higher than it would otherwise be.
The Verdict On Téléverbier's P/E Ratio
Téléverbier trades on a P/E ratio of 21.4, which is above its market average of 14.2. The excess cash it carries is the gravy on top its fast EPS growth. So based on this analysis we'd expect Téléverbier to have a high P/E ratio.
Investors should be looking to buy stocks that the market is wrong about. If the reality for a company is better than it expects, you can make money by buying and holding for the long term. We don't have analyst forecasts, but you might want to assess this data-rich visualization of earnings, revenue and cash flow.
You might be able to find a better buy than Téléverbier. If you want a selection of possible winners, check out this free list of interesting companies that trade on a P/E below 20 (but have proven they can grow earnings).
If you spot an error that warrants correction, please contact the editor at editorial-team@simplywallst.com. This article by Simply Wall St is general in nature. It does not constitute a recommendation to buy or sell any stock, and does not take account of your objectives, or your financial situation. Simply Wall St has no position in the stocks mentioned.
We aim to bring you long-term focused research analysis driven by fundamental data. Note that our analysis may not factor in the latest price-sensitive company announcements or qualitative material. Thank you for reading.
