Are Universal Corporation's (NYSE:UVV) Mixed Financials Driving The Negative Sentiment?
Universal (NYSE:UVV) has had a rough three months with its share price down 10%. It seems that the market might have completely ignored the positive aspects of the company's fundamentals and decided to weigh-in more on the negative aspects. Stock prices are usually driven by a company’s financial performance over the long term, and therefore we decided to pay more attention to the company's financial performance. Particularly, we will be paying attention to Universal's ROE today.
Return on equity or ROE is a key measure used to assess how efficiently a company's management is utilizing the company's capital. In other words, it is a profitability ratio which measures the rate of return on the capital provided by the company's shareholders.
See our latest analysis for Universal
How Do You Calculate Return On Equity?
ROE can be calculated by using the formula:
Return on Equity = Net Profit (from continuing operations) ÷ Shareholders' Equity
So, based on the above formula, the ROE for Universal is:
7.1% = US$96m ÷ US$1.3b (Based on the trailing twelve months to March 2021).
The 'return' is the profit over the last twelve months. One way to conceptualize this is that for each $1 of shareholders' capital it has, the company made $0.07 in profit.
What Has ROE Got To Do With Earnings Growth?
Thus far, we have learned that ROE measures how efficiently a company is generating its profits. Depending on how much of these profits the company reinvests or "retains", and how effectively it does so, we are then able to assess a company’s earnings growth potential. Assuming all else is equal, companies that have both a higher return on equity and higher profit retention are usually the ones that have a higher growth rate when compared to companies that don't have the same features.
A Side By Side comparison of Universal's Earnings Growth And 7.1% ROE
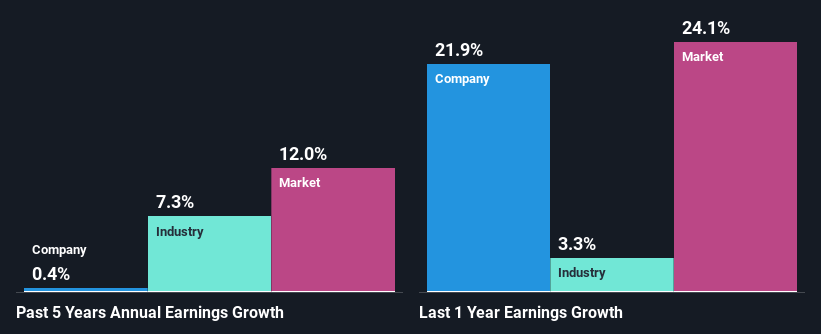
When you first look at it, Universal's ROE doesn't look that attractive. A quick further study shows that the company's ROE doesn't compare favorably to the industry average of 18% either. Hence, the flat earnings seen by Universal over the past five years could probably be the result of it having a lower ROE.
Next, on comparing Universal's net income growth with the industry, we found that the company's reported growth is similar to the industry average growth rate of 0.4% in the same period.
Earnings growth is an important metric to consider when valuing a stock. It’s important for an investor to know whether the market has priced in the company's expected earnings growth (or decline). Doing so will help them establish if the stock's future looks promising or ominous. One good indicator of expected earnings growth is the P/E ratio which determines the price the market is willing to pay for a stock based on its earnings prospects. So, you may want to check if Universal is trading on a high P/E or a low P/E, relative to its industry.
Is Universal Efficiently Re-investing Its Profits?
With a high three-year median payout ratio of 85% (implying that the company keeps only 15% of its income) of its business to reinvest into its business), most of Universal's profits are being paid to shareholders, which explains the absence of growth in earnings.
In addition, Universal has been paying dividends over a period of at least ten years suggesting that keeping up dividend payments is way more important to the management even if it comes at the cost of business growth.
Conclusion
On the whole, we feel that the performance shown by Universal can be open to many interpretations. While no doubt its earnings growth is pretty respectable, the low profit retention could mean that the company's earnings growth could have been higher, had it been paying reinvesting a higher portion of its profits. An improvement in its ROE could also help future earnings growth. Up till now, we've only made a short study of the company's growth data. To gain further insights into Universal's past profit growth, check out this visualization of past earnings, revenue and cash flows.
This article by Simply Wall St is general in nature. It does not constitute a recommendation to buy or sell any stock, and does not take account of your objectives, or your financial situation. We aim to bring you long-term focused analysis driven by fundamental data. Note that our analysis may not factor in the latest price-sensitive company announcements or qualitative material. Simply Wall St has no position in any stocks mentioned.
Have feedback on this article? Concerned about the content? Get in touch with us directly. Alternatively, email editorial-team (at) simplywallst.com.
