Declining Stock and Decent Financials: Is The Market Wrong About SYNLAB AG (ETR:SYAB)?
It is hard to get excited after looking at SYNLAB's (ETR:SYAB) recent performance, when its stock has declined 10% over the past three months. However, the company's fundamentals look pretty decent, and long-term financials are usually aligned with future market price movements. In this article, we decided to focus on SYNLAB's ROE.
ROE or return on equity is a useful tool to assess how effectively a company can generate returns on the investment it received from its shareholders. In short, ROE shows the profit each dollar generates with respect to its shareholder investments.
See our latest analysis for SYNLAB
How To Calculate Return On Equity?
Return on equity can be calculated by using the formula:
Return on Equity = Net Profit (from continuing operations) ÷ Shareholders' Equity
So, based on the above formula, the ROE for SYNLAB is:
4.0% = €93m ÷ €2.3b (Based on the trailing twelve months to December 2023).
The 'return' is the amount earned after tax over the last twelve months. So, this means that for every €1 of its shareholder's investments, the company generates a profit of €0.04.
What Is The Relationship Between ROE And Earnings Growth?
So far, we've learned that ROE is a measure of a company's profitability. Based on how much of its profits the company chooses to reinvest or "retain", we are then able to evaluate a company's future ability to generate profits. Assuming all else is equal, companies that have both a higher return on equity and higher profit retention are usually the ones that have a higher growth rate when compared to companies that don't have the same features.
SYNLAB's Earnings Growth And 4.0% ROE
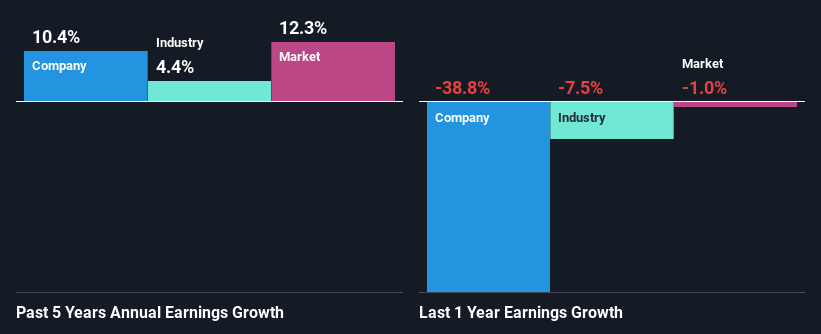
At first glance, SYNLAB's ROE doesn't look very promising. Yet, a closer study shows that the company's ROE is similar to the industry average of 4.9%. Having said that, SYNLAB has shown a modest net income growth of 10% over the past five years. Given the slightly low ROE, it is likely that there could be some other aspects that are driving this growth. For example, it is possible that the company's management has made some good strategic decisions, or that the company has a low payout ratio.
Next, on comparing with the industry net income growth, we found that SYNLAB's growth is quite high when compared to the industry average growth of 4.4% in the same period, which is great to see.
The basis for attaching value to a company is, to a great extent, tied to its earnings growth. The investor should try to establish if the expected growth or decline in earnings, whichever the case may be, is priced in. Doing so will help them establish if the stock's future looks promising or ominous. One good indicator of expected earnings growth is the P/E ratio which determines the price the market is willing to pay for a stock based on its earnings prospects. So, you may want to check if SYNLAB is trading on a high P/E or a low P/E, relative to its industry.
Is SYNLAB Making Efficient Use Of Its Profits?
While the company did pay out a portion of its dividend in the past, it currently doesn't pay a regular dividend. We infer that the company has been reinvesting all of its profits to grow its business.
Summary
On the whole, we do feel that SYNLAB has some positive attributes. Even in spite of the low rate of return, the company has posted impressive earnings growth as a result of reinvesting heavily into its business. Having said that, looking at the current analyst estimates, we found that the company's earnings are expected to gain momentum. Are these analysts expectations based on the broad expectations for the industry, or on the company's fundamentals? Click here to be taken to our analyst's forecasts page for the company.
Have feedback on this article? Concerned about the content? Get in touch with us directly. Alternatively, email editorial-team (at) simplywallst.com.
This article by Simply Wall St is general in nature. We provide commentary based on historical data and analyst forecasts only using an unbiased methodology and our articles are not intended to be financial advice. It does not constitute a recommendation to buy or sell any stock, and does not take account of your objectives, or your financial situation. We aim to bring you long-term focused analysis driven by fundamental data. Note that our analysis may not factor in the latest price-sensitive company announcements or qualitative material. Simply Wall St has no position in any stocks mentioned.
