Is Ensign Group (NASDAQ:ENSG) Using Too Much Debt?
Warren Buffett famously said, 'Volatility is far from synonymous with risk.' When we think about how risky a company is, we always like to look at its use of debt, since debt overload can lead to ruin. We note that The Ensign Group, Inc. (NASDAQ:ENSG) does have debt on its balance sheet. But the real question is whether this debt is making the company risky.
When Is Debt A Problem?
Generally speaking, debt only becomes a real problem when a company can't easily pay it off, either by raising capital or with its own cash flow. Ultimately, if the company can't fulfill its legal obligations to repay debt, shareholders could walk away with nothing. While that is not too common, we often do see indebted companies permanently diluting shareholders because lenders force them to raise capital at a distressed price. Of course, plenty of companies use debt to fund growth, without any negative consequences. The first thing to do when considering how much debt a business uses is to look at its cash and debt together.
See our latest analysis for Ensign Group
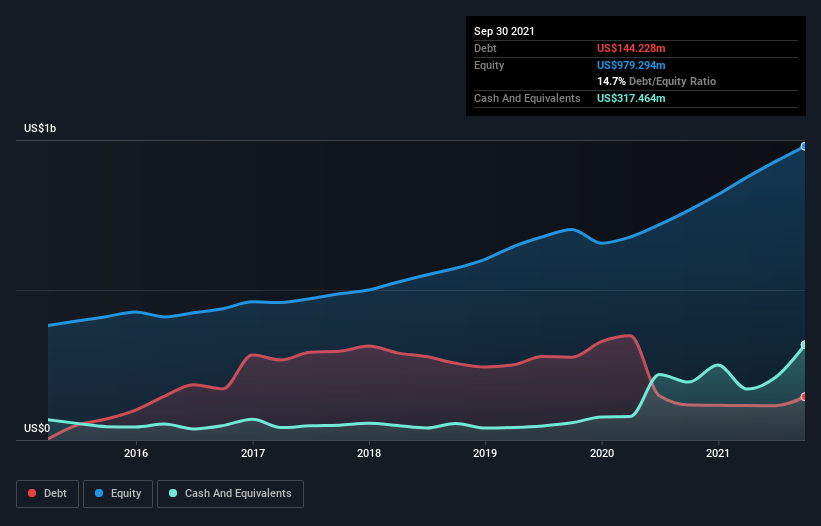
How Much Debt Does Ensign Group Carry?
As you can see below, at the end of September 2021, Ensign Group had US$144.2m of debt, up from US$116.4m a year ago. Click the image for more detail. However, it does have US$317.5m in cash offsetting this, leading to net cash of US$173.2m.
A Look At Ensign Group's Liabilities
We can see from the most recent balance sheet that Ensign Group had liabilities of US$483.1m falling due within a year, and liabilities of US$1.35b due beyond that. On the other hand, it had cash of US$317.5m and US$313.9m worth of receivables due within a year. So its liabilities outweigh the sum of its cash and (near-term) receivables by US$1.20b.
While this might seem like a lot, it is not so bad since Ensign Group has a market capitalization of US$4.15b, and so it could probably strengthen its balance sheet by raising capital if it needed to. However, it is still worthwhile taking a close look at its ability to pay off debt. While it does have liabilities worth noting, Ensign Group also has more cash than debt, so we're pretty confident it can manage its debt safely.
Another good sign is that Ensign Group has been able to increase its EBIT by 21% in twelve months, making it easier to pay down debt. When analysing debt levels, the balance sheet is the obvious place to start. But ultimately the future profitability of the business will decide if Ensign Group can strengthen its balance sheet over time. So if you want to see what the professionals think, you might find this free report on analyst profit forecasts to be interesting.
Finally, while the tax-man may adore accounting profits, lenders only accept cold hard cash. While Ensign Group has net cash on its balance sheet, it's still worth taking a look at its ability to convert earnings before interest and tax (EBIT) to free cash flow, to help us understand how quickly it is building (or eroding) that cash balance. Over the last three years, Ensign Group recorded free cash flow worth a fulsome 80% of its EBIT, which is stronger than we'd usually expect. That positions it well to pay down debt if desirable to do so.
Summing up
Although Ensign Group's balance sheet isn't particularly strong, due to the total liabilities, it is clearly positive to see that it has net cash of US$173.2m. The cherry on top was that in converted 80% of that EBIT to free cash flow, bringing in US$226m. So is Ensign Group's debt a risk? It doesn't seem so to us. Above most other metrics, we think its important to track how fast earnings per share is growing, if at all. If you've also come to that realization, you're in luck, because today you can view this interactive graph of Ensign Group's earnings per share history for free.
When all is said and done, sometimes its easier to focus on companies that don't even need debt. Readers can access a list of growth stocks with zero net debt 100% free, right now.
Have feedback on this article? Concerned about the content? Get in touch with us directly. Alternatively, email editorial-team (at) simplywallst.com.
This article by Simply Wall St is general in nature. We provide commentary based on historical data and analyst forecasts only using an unbiased methodology and our articles are not intended to be financial advice. It does not constitute a recommendation to buy or sell any stock, and does not take account of your objectives, or your financial situation. We aim to bring you long-term focused analysis driven by fundamental data. Note that our analysis may not factor in the latest price-sensitive company announcements or qualitative material. Simply Wall St has no position in any stocks mentioned.
