Safety Insurance Group, Inc.'s (NASDAQ:SAFT) Fundamentals Look Pretty Strong: Could The Market Be Wrong About The Stock?
Safety Insurance Group (NASDAQ:SAFT) has had a rough week with its share price down 2.8%. However, a closer look at its sound financials might cause you to think again. Given that fundamentals usually drive long-term market outcomes, the company is worth looking at. In this article, we decided to focus on Safety Insurance Group's ROE.
ROE or return on equity is a useful tool to assess how effectively a company can generate returns on the investment it received from its shareholders. Put another way, it reveals the company's success at turning shareholder investments into profits.
View our latest analysis for Safety Insurance Group
How Is ROE Calculated?
Return on equity can be calculated by using the formula:
Return on Equity = Net Profit (from continuing operations) ÷ Shareholders' Equity
So, based on the above formula, the ROE for Safety Insurance Group is:
19% = US$172m ÷ US$920m (Based on the trailing twelve months to June 2021).
The 'return' is the income the business earned over the last year. One way to conceptualize this is that for each $1 of shareholders' capital it has, the company made $0.19 in profit.
What Is The Relationship Between ROE And Earnings Growth?
So far, we've learned that ROE is a measure of a company's profitability. Based on how much of its profits the company chooses to reinvest or "retain", we are then able to evaluate a company's future ability to generate profits. Assuming everything else remains unchanged, the higher the ROE and profit retention, the higher the growth rate of a company compared to companies that don't necessarily bear these characteristics.
A Side By Side comparison of Safety Insurance Group's Earnings Growth And 19% ROE
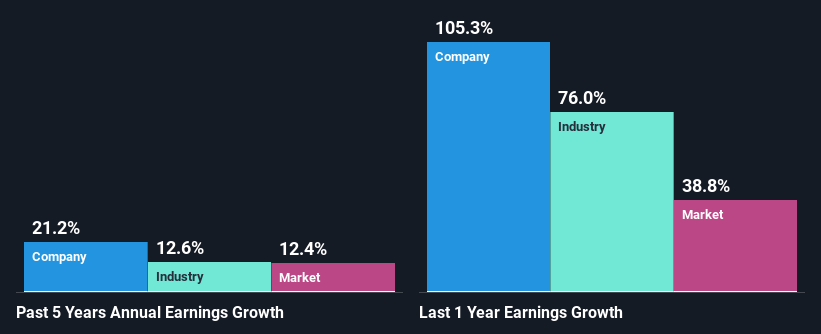
To begin with, Safety Insurance Group seems to have a respectable ROE. Further, the company's ROE compares quite favorably to the industry average of 12%. Probably as a result of this, Safety Insurance Group was able to see an impressive net income growth of 21% over the last five years. However, there could also be other causes behind this growth. Such as - high earnings retention or an efficient management in place.
As a next step, we compared Safety Insurance Group's net income growth with the industry, and pleasingly, we found that the growth seen by the company is higher than the average industry growth of 13%.
Earnings growth is an important metric to consider when valuing a stock. The investor should try to establish if the expected growth or decline in earnings, whichever the case may be, is priced in. Doing so will help them establish if the stock's future looks promising or ominous. If you're wondering about Safety Insurance Group's's valuation, check out this gauge of its price-to-earnings ratio, as compared to its industry.
Is Safety Insurance Group Making Efficient Use Of Its Profits?
The high three-year median payout ratio of 52% (implying that it keeps only 48% of profits) for Safety Insurance Group suggests that the company's growth wasn't really hampered despite it returning most of the earnings to its shareholders.
Besides, Safety Insurance Group has been paying dividends for at least ten years or more. This shows that the company is committed to sharing profits with its shareholders.
Summary
In total, we are pretty happy with Safety Insurance Group's performance. In particular, its high ROE is quite noteworthy and also the probable explanation behind its considerable earnings growth. Yet, the company is retaining a small portion of its profits. Which means that the company has been able to grow its earnings in spite of it, so that's not too bad. Up till now, we've only made a short study of the company's growth data. So it may be worth checking this free detailed graph of Safety Insurance Group's past earnings, as well as revenue and cash flows to get a deeper insight into the company's performance.
This article by Simply Wall St is general in nature. We provide commentary based on historical data and analyst forecasts only using an unbiased methodology and our articles are not intended to be financial advice. It does not constitute a recommendation to buy or sell any stock, and does not take account of your objectives, or your financial situation. We aim to bring you long-term focused analysis driven by fundamental data. Note that our analysis may not factor in the latest price-sensitive company announcements or qualitative material. Simply Wall St has no position in any stocks mentioned.
Have feedback on this article? Concerned about the content? Get in touch with us directly. Alternatively, email editorial-team (at) simplywallst.com.
