NIKE (NKE) Q3 Earnings & Revenues Beat on Brand Strength
NIKE Inc. NKE reported third-quarter fiscal 2023 results, wherein revenues and earnings beat the Zacks Consensus Estimate. Results gained from the Consumer Direct Acceleration strategy, compelling product innovation and solid online show.
Following the strong results, shares of NIKE fell more than 2% in the after-hours trading session on Mar 21. This might be due to expected margin pressures stemming from its efforts to eliminate excess inventory through heavy discounts.
Overall, shares of the Zacks Rank #2 (Buy) company have gained 7.6% in the past three months compared with the industry’s growth of 4.2%.
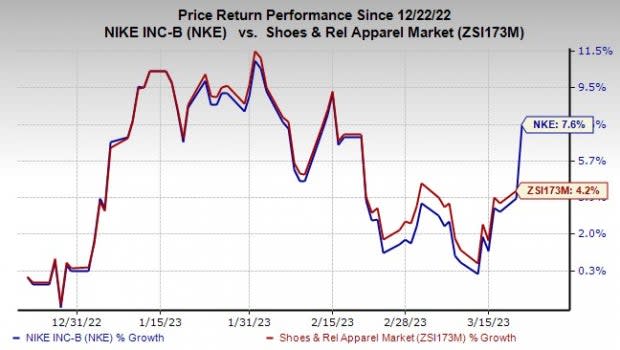
Image Source: Zacks Investment Research
Q3 Highlights
In third-quarter fiscal 2023, the company’s earnings per share were 79 cents, down 9% from 83 cents reported in the year-ago quarter. However, the metric beat the Zacks Consensus Estimate of 52 cents and our estimate of 43 cents.
Revenues of the Swoosh brand owner grew 14% year over year to $12,390 million and surpassed the Zacks Consensus Estimate of $11,463 million and our estimate of $10,989.8 million. On a currency-neutral basis, revenues advanced 19% year over year, driven by broad-based across all brands, channels and geographies.
Sales at NIKE Direct were $5.3 billion, up 17% on a reported basis and 22% on a currency-neutral basis. The 22% currency-neutral increase included 24% growth at NIKE Digital and a 19% rise at NIKE stores.
The NIKE Brand Digital’s revenues improved 20% on a reported basis and 24% on a currency-neutral basis on the back of double-digit increases in traffic on its mobile app.
Wholesale revenues improved 12% on a reported basis and 18% on a currency-neutral basis. The results reflected gains from strong partner demand based on accelerating retail sales and higher shipments.
Operating Segments
The NIKE Brand revenues were $11,766 million, up 14% year over year on a reported basis. We estimated NIKE Brand revenues of $10,440.9 million, reflecting year-over-year growth of 1.1%. Revenues for the brand rose 19% on a currency-neutral basis. Results were driven by double-digit growth in North America, EMEA and APLA. Also, Greater China grew 1% on a cc basis but fell 8% on a reported basis.
Within the NIKE brand, revenues in North America advanced 27% on a reported basis and on a currency-neutral basis, each to $4,913 million. The upside can be attributed to strong holiday sales and strength across performance and lifestyle. Sales for the NIKE Direct business were up 23% in the region. Digital sales grew 25%, owing to double-digit growth in traffic and repeat buying trends by members.
In EMEA, the company’s revenues rose 17% on a reported basis and 26% on a currency-neutral basis to $3,246 million, driven by strong growth across all Western European markets, including positive trends in the U.K. NIKE Direct revenues for the segment grew 39% on a currency-neutral basis, with 43% growth in NIKE Digital. Double-digit growth in traffic with average order value rising in mid-single digits, new member acquisition and double-digit member engagement on the NIKE App were upsides.
In Greater China, revenues declined 8% year over year on a reported basis and rose 1% on a currency-neutral basis in the fiscal third quarter to $1,994 million. The region has been witnessing a rebound in brick-and-mortar traffic with strong retail momentum during the Chinese New Year and a clean inventory position. NIKE Direct rose 3% on a currency-neutral basis, while NIKE Digital revenues fell 11% year over year.
In APLA, NIKE revenues advanced 10% on a reported basis and 15% on a currency-neutral basis to $1,601 million. NIKE Direct advanced 22% on a currency-neutral basis, driven by a 23% surge in NIKE Digital.
Revenues at the Converse brand grew 8% on a reported basis to $612 million. On a currency-neutral basis, revenues of the segment were up 12%, backed by double-digit growth in North America, somewhat offset by sluggishness in Asia.
Costs & Margins
The gross profit rose 6% year over year to $5,371 million, while the gross margin contracted 330 basis points (bps) to 43.3%. The decline in the gross margin can be attributed to higher markdowns to liquidate inventory, increased freight and logistics costs, elevated product input costs, and currency headwinds. This was partly negated by the company’s pricing actions.
Selling and administrative expenses rose 15% to $3,959 million. As a percentage of sales, SG&A expenses expanded 40 bps from the prior-year quarter to 32%.
Demand-creation expenses increased 8% year over year to $900 million, owing to elevated marketing and advertising investments.
Operating overhead expenses were up 17% to $3,022 million on higher wage-related expenses and NIKE Direct costs.
Balance Sheet & Shareholder-Friendly Moves
The company ended the quarter with cash and short-term investments of $6,955 million, down 20% year over year. It had long-term debt (excluding current maturities) of $8,925 million and shareholders’ equity of $14,531 million as of Feb 28, 2023.
As of Feb 28, 2023, inventories of $8,905 million increased 16% from the prior-year levels due to increased freight costs and higher input costs.
In third-quarter fiscal 2023, the company returned $2 billion to shareholders, including $1.5 billion in share repurchases and $528 million in dividends. As of Feb 28, 2023, it bought back 32.0 million shares under the existing $3.4-billion program. The company hiked its dividend by 9%, marking the 21st consecutive year of a dividend increase.
NIKE, Inc. Price, Consensus and EPS Surprise
NIKE, Inc. price-consensus-eps-surprise-chart | NIKE, Inc. Quote
Outlook
Management has been concerned about the pressure on consumer confidence and the uncertain macro environment. For fiscal 2023, it expects revenues to grow in the high-single digits, up from the prior mentioned mid-single-digit growth. The sales view includes approximately 600 basis points of foreign exchange headwinds. For the fiscal fourth quarter, the metric is anticipated to see flat to low-single-digit revenue growth. This is likely to result in moderate wholesale revenue growth for the next few quarters.
The fiscal 2023 gross margin is envisioned to contract 250 basis points, at the low end of its earlier mentioned range. This reflects ongoing and accelerated actions to reduce inventory by year-end, higher freight and logistics expenses, and 100 basis points of foreign exchange headwinds. SG&A expenses are predicted to increase 10%. The effective tax rate is forecast to be in the high-teens range.
Other Stocks to Consider
Some other top-ranked companies are Ralph Lauren RL, H&R Block HRB and Deckers Outdoor DECK.
Ralph Lauren, a footwear and accessories dealer, has a Zacks Rank #1 (Strong Buy) at present. You can see the complete list of today’s Zacks #1 Rank stocks here.
The Zacks Consensus Estimate for Ralph Lauren’s next-financial-year sales and EPS suggests growth of 5% and 12.8%, respectively, from the year-ago reported figures. RL has a trailing four-quarter earnings surprise of 23.6%, on average.
Deckers Outdoor currently carries a Zacks Rank #2. The company has a trailing four-quarter earnings surprise of 31%, on average.
The Zacks Consensus Estimate for Deckers Outdoor’s current financial-year sales and earnings suggests growth of 12% and 13.5% from the year-ago period’s reported numbers, respectively.
H&R Block provides assisted income tax return preparation and do-it-yourself tax return preparation services. HRB currently carries a Zacks Rank #2.
The Zacks Consensus Estimate for H&R Block’s current financial year’s EPS suggests growth of 9.4% from the year-ago reported figure. H&R Block has a trailing four-quarter earnings surprise of 10.7%, on average.
Want the latest recommendations from Zacks Investment Research? Today, you can download 7 Best Stocks for the Next 30 Days. Click to get this free report
NIKE, Inc. (NKE) : Free Stock Analysis Report
Deckers Outdoor Corporation (DECK) : Free Stock Analysis Report
Ralph Lauren Corporation (RL) : Free Stock Analysis Report
H&R Block, Inc. (HRB) : Free Stock Analysis Report
