Institutional investors in Regions Financial Corporation (NYSE:RF) see US$818m decrease in market cap last week, although long-term gains have benefitted them.
Key Insights
Significantly high institutional ownership implies Regions Financial's stock price is sensitive to their trading actions
50% of the business is held by the top 14 shareholders
Ownership research along with analyst forecasts data help provide a good understanding of opportunities in a stock
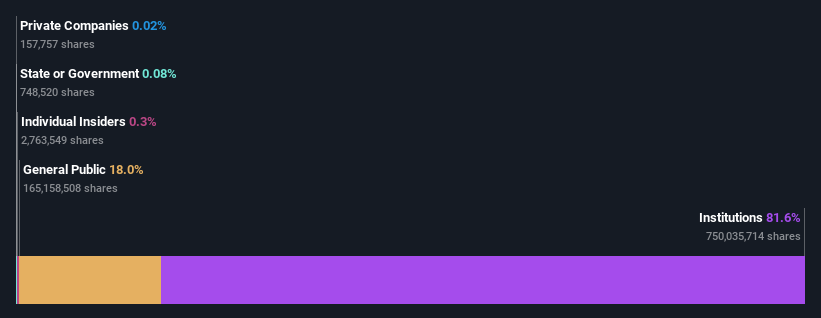
Every investor in Regions Financial Corporation (NYSE:RF) should be aware of the most powerful shareholder groups. With 82% stake, institutions possess the maximum shares in the company. Put another way, the group faces the maximum upside potential (or downside risk).
Institutional investors was the group most impacted after the company's market cap fell to US$19b last week. However, the 16% one-year returns may have helped alleviate their overall losses. But they would probably be wary of future losses.
Let's delve deeper into each type of owner of Regions Financial, beginning with the chart below.
View our latest analysis for Regions Financial
What Does The Institutional Ownership Tell Us About Regions Financial?
Many institutions measure their performance against an index that approximates the local market. So they usually pay more attention to companies that are included in major indices.
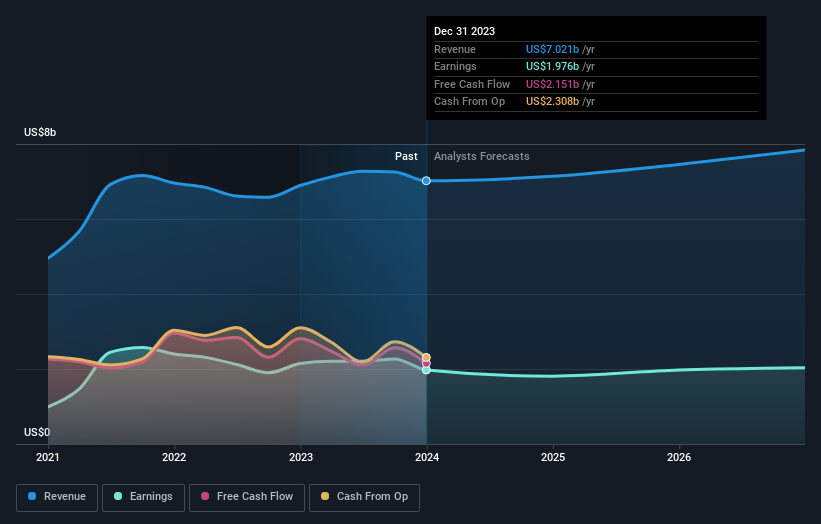
As you can see, institutional investors have a fair amount of stake in Regions Financial. This suggests some credibility amongst professional investors. But we can't rely on that fact alone since institutions make bad investments sometimes, just like everyone does. If multiple institutions change their view on a stock at the same time, you could see the share price drop fast. It's therefore worth looking at Regions Financial's earnings history below. Of course, the future is what really matters.
Investors should note that institutions actually own more than half the company, so they can collectively wield significant power. Hedge funds don't have many shares in Regions Financial. The company's largest shareholder is The Vanguard Group, Inc., with ownership of 13%. Meanwhile, the second and third largest shareholders, hold 9.6% and 6.3%, of the shares outstanding, respectively.
A closer look at our ownership figures suggests that the top 14 shareholders have a combined ownership of 50% implying that no single shareholder has a majority.
Researching institutional ownership is a good way to gauge and filter a stock's expected performance. The same can be achieved by studying analyst sentiments. Quite a few analysts cover the stock, so you could look into forecast growth quite easily.
Insider Ownership Of Regions Financial
The definition of an insider can differ slightly between different countries, but members of the board of directors always count. The company management answer to the board and the latter should represent the interests of shareholders. Notably, sometimes top-level managers are on the board themselves.
Most consider insider ownership a positive because it can indicate the board is well aligned with other shareholders. However, on some occasions too much power is concentrated within this group.
Our most recent data indicates that insiders own less than 1% of Regions Financial Corporation. Being so large, we would not expect insiders to own a large proportion of the stock. Collectively, they own US$56m of stock. In this sort of situation, it can be more interesting to see if those insiders have been buying or selling.
General Public Ownership
The general public-- including retail investors -- own 18% stake in the company, and hence can't easily be ignored. While this size of ownership may not be enough to sway a policy decision in their favour, they can still make a collective impact on company policies.
Next Steps:
While it is well worth considering the different groups that own a company, there are other factors that are even more important.
I always like to check for a history of revenue growth. You can too, by accessing this free chart of historic revenue and earnings in this detailed graph.
But ultimately it is the future, not the past, that will determine how well the owners of this business will do. Therefore we think it advisable to take a look at this free report showing whether analysts are predicting a brighter future.
NB: Figures in this article are calculated using data from the last twelve months, which refer to the 12-month period ending on the last date of the month the financial statement is dated. This may not be consistent with full year annual report figures.
Have feedback on this article? Concerned about the content? Get in touch with us directly. Alternatively, email editorial-team (at) simplywallst.com.
This article by Simply Wall St is general in nature. We provide commentary based on historical data and analyst forecasts only using an unbiased methodology and our articles are not intended to be financial advice. It does not constitute a recommendation to buy or sell any stock, and does not take account of your objectives, or your financial situation. We aim to bring you long-term focused analysis driven by fundamental data. Note that our analysis may not factor in the latest price-sensitive company announcements or qualitative material. Simply Wall St has no position in any stocks mentioned.
