American Airlines Group (NASDAQ:AAL shareholders incur further losses as stock declines 12% this week, taking five-year losses to 64%
Statistically speaking, long term investing is a profitable endeavour. But along the way some stocks are going to perform badly. For example, after five long years the American Airlines Group Inc. (NASDAQ:AAL) share price is a whole 65% lower. That's not a lot of fun for true believers. Shareholders have had an even rougher run lately, with the share price down 15% in the last 90 days. Of course, this share price action may well have been influenced by the 7.9% decline in the broader market, throughout the period.
Since American Airlines Group has shed US$1.4b from its value in the past 7 days, let's see if the longer term decline has been driven by the business' economics.
Check out our latest analysis for American Airlines Group
American Airlines Group wasn't profitable in the last twelve months, it is unlikely we'll see a strong correlation between its share price and its earnings per share (EPS). Arguably revenue is our next best option. Generally speaking, companies without profits are expected to grow revenue every year, and at a good clip. As you can imagine, fast revenue growth, when maintained, often leads to fast profit growth.
In the last five years American Airlines Group saw its revenue shrink by 13% per year. That's definitely a weaker result than most pre-profit companies report. It seems appropriate, then, that the share price slid about 11% annually during that time. It's fair to say most investors don't like to invest in loss making companies with falling revenue. This looks like a really risky stock to buy, at a glance.
The image below shows how earnings and revenue have tracked over time (if you click on the image you can see greater detail).
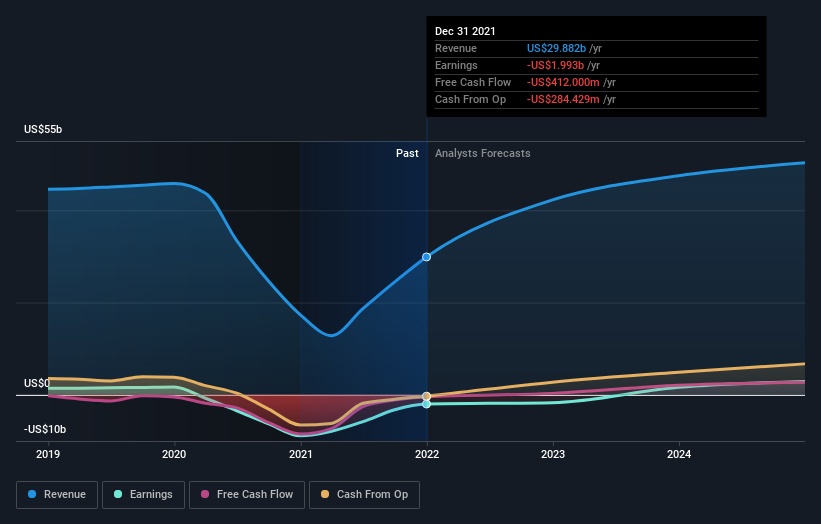
American Airlines Group is a well known stock, with plenty of analyst coverage, suggesting some visibility into future growth. So we recommend checking out this free report showing consensus forecasts
A Different Perspective
American Airlines Group shareholders are up 3.0% for the year. But that was short of the market average. But at least that's still a gain! Over five years the TSR has been a reduction of 10% per year, over five years. It could well be that the business is stabilizing. It's always interesting to track share price performance over the longer term. But to understand American Airlines Group better, we need to consider many other factors. For example, we've discovered 4 warning signs for American Airlines Group (2 can't be ignored!) that you should be aware of before investing here.
We will like American Airlines Group better if we see some big insider buys. While we wait, check out this free list of growing companies with considerable, recent, insider buying.
Please note, the market returns quoted in this article reflect the market weighted average returns of stocks that currently trade on US exchanges.
Have feedback on this article? Concerned about the content? Get in touch with us directly. Alternatively, email editorial-team (at) simplywallst.com.
This article by Simply Wall St is general in nature. We provide commentary based on historical data and analyst forecasts only using an unbiased methodology and our articles are not intended to be financial advice. It does not constitute a recommendation to buy or sell any stock, and does not take account of your objectives, or your financial situation. We aim to bring you long-term focused analysis driven by fundamental data. Note that our analysis may not factor in the latest price-sensitive company announcements or qualitative material. Simply Wall St has no position in any stocks mentioned.
