Declining Stock and Solid Fundamentals: Is The Market Wrong About Chubb Limited (NYSE:CB)?
With its stock down 7.3% over the past three months, it is easy to disregard Chubb (NYSE:CB). However, stock prices are usually driven by a company’s financial performance over the long term, which in this case looks quite promising. Particularly, we will be paying attention to Chubb's ROE today.
Return on Equity or ROE is a test of how effectively a company is growing its value and managing investors’ money. Simply put, it is used to assess the profitability of a company in relation to its equity capital.
Check out our latest analysis for Chubb
How Do You Calculate Return On Equity?
Return on equity can be calculated by using the formula:
Return on Equity = Net Profit (from continuing operations) ÷ Shareholders' Equity
So, based on the above formula, the ROE for Chubb is:
14% = US$8.2b ÷ US$57b (Based on the trailing twelve months to March 2022).
The 'return' is the profit over the last twelve months. So, this means that for every $1 of its shareholder's investments, the company generates a profit of $0.14.
Why Is ROE Important For Earnings Growth?
So far, we've learned that ROE is a measure of a company's profitability. Depending on how much of these profits the company reinvests or "retains", and how effectively it does so, we are then able to assess a company’s earnings growth potential. Assuming everything else remains unchanged, the higher the ROE and profit retention, the higher the growth rate of a company compared to companies that don't necessarily bear these characteristics.
Chubb's Earnings Growth And 14% ROE
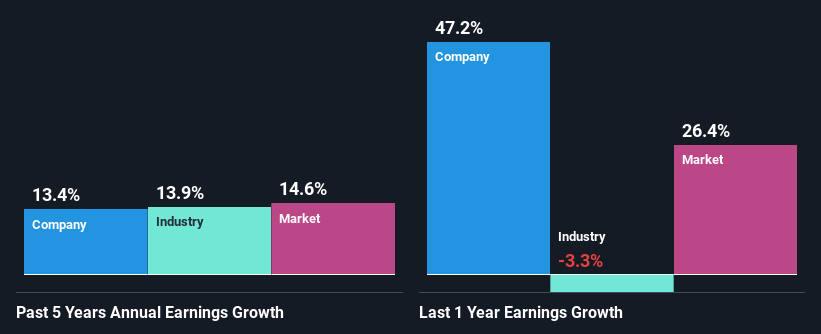
To begin with, Chubb seems to have a respectable ROE. And on comparing with the industry, we found that the the average industry ROE is similar at 12%. This probably goes some way in explaining Chubb's moderate 13% growth over the past five years amongst other factors.
As a next step, we compared Chubb's net income growth with the industry and found that the company has a similar growth figure when compared with the industry average growth rate of 14% in the same period.
Earnings growth is a huge factor in stock valuation. The investor should try to establish if the expected growth or decline in earnings, whichever the case may be, is priced in. Doing so will help them establish if the stock's future looks promising or ominous. Is CB fairly valued? This infographic on the company's intrinsic value has everything you need to know.
Is Chubb Using Its Retained Earnings Effectively?
With a three-year median payout ratio of 34% (implying that the company retains 66% of its profits), it seems that Chubb is reinvesting efficiently in a way that it sees respectable amount growth in its earnings and pays a dividend that's well covered.
Moreover, Chubb is determined to keep sharing its profits with shareholders which we infer from its long history of paying a dividend for at least ten years. Our latest analyst data shows that the future payout ratio of the company is expected to drop to 20% over the next three years. Regardless, the future ROE for Chubb is predicted to decline to 12% despite the anticipated decrease in the payout ratio. We reckon that there could probably be other factors that could be driving the forseen decline in the company's ROE.
Summary
In total, we are pretty happy with Chubb's performance. Specifically, we like that the company is reinvesting a huge chunk of its profits at a high rate of return. This of course has caused the company to see substantial growth in its earnings. Having said that, the company's earnings growth is expected to slow down, as forecasted in the current analyst estimates. Are these analysts expectations based on the broad expectations for the industry, or on the company's fundamentals? Click here to be taken to our analyst's forecasts page for the company.
Have feedback on this article? Concerned about the content? Get in touch with us directly. Alternatively, email editorial-team (at) simplywallst.com.
This article by Simply Wall St is general in nature. We provide commentary based on historical data and analyst forecasts only using an unbiased methodology and our articles are not intended to be financial advice. It does not constitute a recommendation to buy or sell any stock, and does not take account of your objectives, or your financial situation. We aim to bring you long-term focused analysis driven by fundamental data. Note that our analysis may not factor in the latest price-sensitive company announcements or qualitative material. Simply Wall St has no position in any stocks mentioned.
