Should Weakness in All for One Group SE's (ETR:A1OS) Stock Be Seen As A Sign That Market Will Correct The Share Price Given Decent Financials?
With its stock down 7.1% over the past three months, it is easy to disregard All for One Group (ETR:A1OS). But if you pay close attention, you might find that its key financial indicators look quite decent, which could mean that the stock could potentially rise in the long-term given how markets usually reward more resilient long-term fundamentals. In this article, we decided to focus on All for One Group's ROE.
ROE or return on equity is a useful tool to assess how effectively a company can generate returns on the investment it received from its shareholders. Put another way, it reveals the company's success at turning shareholder investments into profits.
Check out our latest analysis for All for One Group
How Do You Calculate Return On Equity?
Return on equity can be calculated by using the formula:
Return on Equity = Net Profit (from continuing operations) ÷ Shareholders' Equity
So, based on the above formula, the ROE for All for One Group is:
9.4% = €9.3m ÷ €99m (Based on the trailing twelve months to June 2023).
The 'return' is the income the business earned over the last year. Another way to think of that is that for every €1 worth of equity, the company was able to earn €0.09 in profit.
What Is The Relationship Between ROE And Earnings Growth?
So far, we've learned that ROE is a measure of a company's profitability. Based on how much of its profits the company chooses to reinvest or "retain", we are then able to evaluate a company's future ability to generate profits. Assuming all else is equal, companies that have both a higher return on equity and higher profit retention are usually the ones that have a higher growth rate when compared to companies that don't have the same features.
All for One Group's Earnings Growth And 9.4% ROE
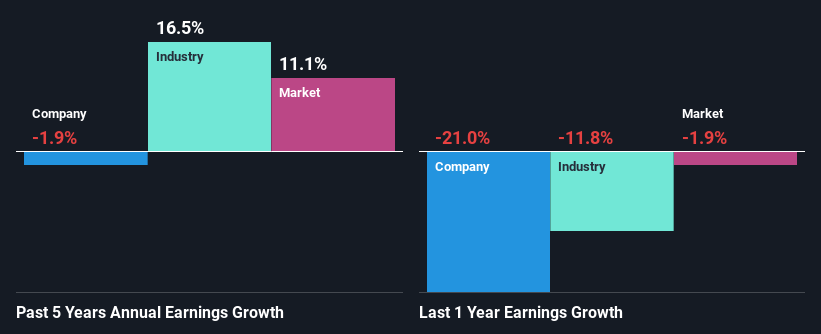
To begin with, All for One Group seems to have a respectable ROE. Further, the company's ROE is similar to the industry average of 11%. Despite this, All for One Group's five year net income growth was quite flat over the past five years. We reckon that there could be some other factors at play here that's limiting the company's growth. Such as, the company pays out a huge portion of its earnings as dividends, or is faced with competitive pressures.
As a next step, we compared All for One Group's net income growth with the industry and discovered that the industry saw an average growth of 16% in the same period.
Earnings growth is a huge factor in stock valuation. It’s important for an investor to know whether the market has priced in the company's expected earnings growth (or decline). This then helps them determine if the stock is placed for a bright or bleak future. Is All for One Group fairly valued compared to other companies? These 3 valuation measures might help you decide.
Is All for One Group Making Efficient Use Of Its Profits?
The high three-year median payout ratio of 54% (meaning, the company retains only 46% of profits) for All for One Group suggests that the company's earnings growth was miniscule as a result of paying out a majority of its earnings.
Moreover, All for One Group has been paying dividends for at least ten years or more suggesting that management must have perceived that the shareholders prefer dividends over earnings growth. Upon studying the latest analysts' consensus data, we found that the company's future payout ratio is expected to drop to 43% over the next three years. The fact that the company's ROE is expected to rise to 16% over the same period is explained by the drop in the payout ratio.
Conclusion
Overall, we feel that All for One Group certainly does have some positive factors to consider. However, while the company does have a high ROE, its earnings growth number is quite disappointing. This can be blamed on the fact that it reinvests only a small portion of its profits and pays out the rest as dividends. That being so, the latest industry analyst forecasts show that the analysts are expecting to see a huge improvement in the company's earnings growth rate. Are these analysts expectations based on the broad expectations for the industry, or on the company's fundamentals? Click here to be taken to our analyst's forecasts page for the company.
Have feedback on this article? Concerned about the content? Get in touch with us directly. Alternatively, email editorial-team (at) simplywallst.com.
This article by Simply Wall St is general in nature. We provide commentary based on historical data and analyst forecasts only using an unbiased methodology and our articles are not intended to be financial advice. It does not constitute a recommendation to buy or sell any stock, and does not take account of your objectives, or your financial situation. We aim to bring you long-term focused analysis driven by fundamental data. Note that our analysis may not factor in the latest price-sensitive company announcements or qualitative material. Simply Wall St has no position in any stocks mentioned.
