Big Tech Earnings Preview: Apple, Amazon and Other Market Movers
Technology stocks have been less than stellar performers this year, with a number of last year’s leaders struggling to find traction in an environment that made the previously shunned cyclical/value stocks more attractive.
You can see the group’s recent performance in the chart below that shows the year-to-date performance of the Zacks Technology sector (red line; middle of the pack, up +18.8%) and the S&P 500 index (light green line; third from bottom, up +16.1%), Microsoft MSFT – dark green line; third from the top, up +30.2%), Apple AAPL – blue line at the bottom, up +11.9%) and Amazon AMZN – orange line, second from the bottom, up +12.4%) and Facebook FB – purple line, second from the top, up +36.3%).
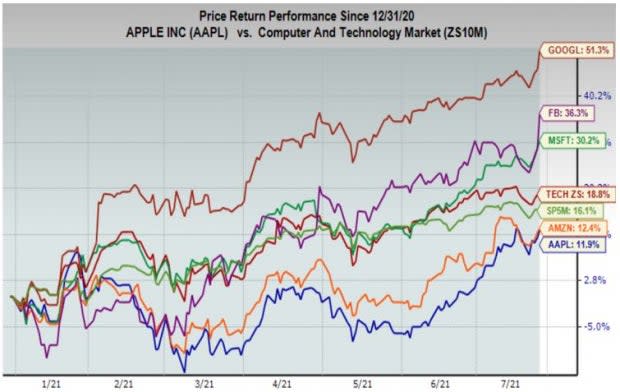
Image Source: Zacks Investment Research
As you can see above, Apple and Amazon are clearly the laggards this year, with Alphabet and Facebook really standing out. The explanation for the Alphabet and Facebook outperformance likely has to do with these operators’ leverage to advertising spending, which was also apparent in the Snap SNAP and Twitter TWTR results that further boosted these stocks.
Microsoft has become a unique Tech player that enjoys multiple growth engines, from enterprise software to cloud leadership and many other things.
Apple and Amazon shares have undoubtedly perked up a bit lately, but nevertheless, remain laggards. It appears the market sees these two leaders’ pandemic outperformance being at the expense of future periods. This view likely explains why the market effectively shrugged standout results from both these players back in April. It will be interesting to see if this week’s quarterly results will help change sentiment on these two stocks.
These five companies combined now account for 23.3% of the total market capitalization of the S&P 500 index, second only to the Technology sector’s weight in the index at 32.5% and above the other 15 sectors, including Finance at 13.4% (Finance’s weight increased from 12.1% in October last year).
The chart below shows the earnings and revenue picture for this group of 5 companies in the aggregate, on a quarterly basis, with expectations for 2021 Q2 highlighted.

Image Source: Zacks Investment Research
The table below shows the group’s earnings picture on an annual basis.
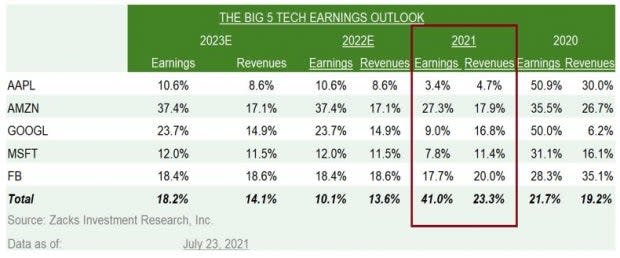
Image Source: Zacks Investment Research
Take a look at the pandemic impacted numbers for 2020 for the group and contrast that to the overall profitability picture for the S&P 500 when the index’s earnings and revenues declined by -13.1% and -1.7%, respectively.
When some people refer to these companies as ‘defensive’ Tech, they are essentially referring to this earnings power that has visibility and stability. The only somewhat negative spin that one could put on these otherwise impressive numbers for the growth is the expected deceleration in the coming periods.
Beyond the big 5 Tech players, total Q2 earnings for the Technology sector as a whole are expected to be up +37.3% from the same period last year on +19.5% higher revenues. The chart below shows the sector’s Q2 earnings and revenue growth expectations in the context of where growth has been in recent quarters and what is expected in the coming three periods.
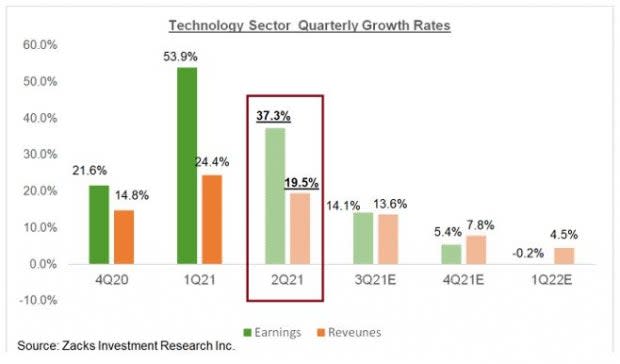
Image Source: Zacks Investment Research
This big picture view of the ‘Big 5’ players as well as the sector as whole shows that current estimates for the coming periods reflect a decelerating growth trend.
Microsoft, Alphabet and Apple will report after the market’s close on Tuesday this week (7/27), while Facebook will report after the market’s close on Wednesday (7/28) and Amazon on Thursday (7/29).
Other notable reports this week include Tesla TSLA after the market’s close on Monday (7/26), Spotify SPOT and a host of blue-chip operators in other sectors. In all, this week brings results from more than 820 companies in total, including 176 S&P 500 members or more than a third of the index’s total membership.
Q2 Earnings Season Scorecard
We now have Q2 results from 120 S&P 500 members or 24% of the index’s total membership. With another 176 index members on deck to report Q2 results this week, we will have seen results from more than 59% of the index’s total membership by the end of this week.
Total earnings (or aggregate net income) for these 120 companies are up +118.9% from the same period last year on +18.4% lower revenues, with 89.2% beating EPS estimates and a record 85% beating revenue estimates.
The two sets of comparison charts below put the Q2 results from these 120 index members in a historical context, which should give us a sense how the Q2 earnings season is tracking at this stage relative to other recent periods.
The first set of comparison charts compare the earnings and revenue growth rates for these 120 index members.
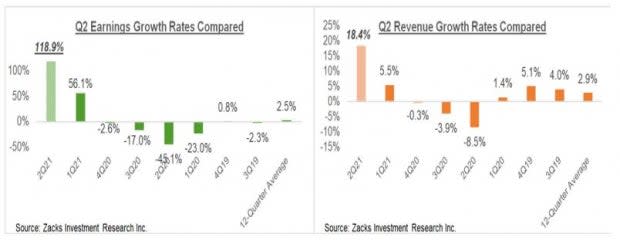
Image Source: Zacks Investment Research
The growth comparison is likely not fair, given the unusually high year-over-year growth rates in the Finance sector, a function of big reserve releases and easy comparisons in 2021 Q2. earnings growth for the remaining companies that have reported drops to only +68.8%. This shows you the power of easy comps, as the year-earlier period was literally battered by the Covid-driven lockdowns and other business disruptions.
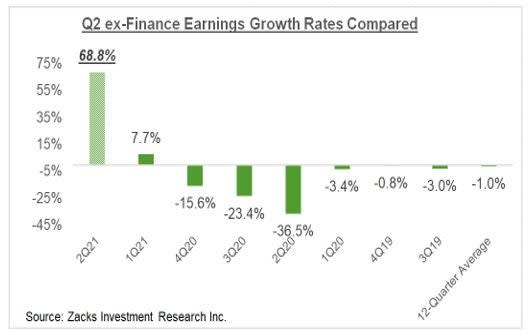
Image Source: Zacks Investment Research
The second set of charts compare the proportion of these 120 index members beating EPS and revenue estimates.
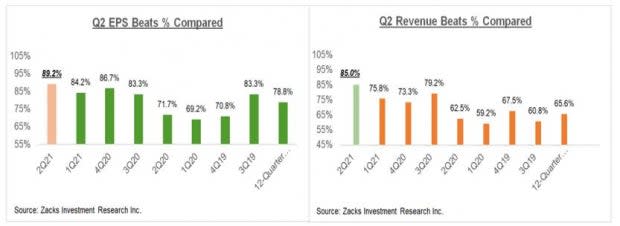
Image Source: Zacks Investment Research
These are impressive numbers, any way you look at them. The momentum on the revenue front is notably striking, both in terms of the growth rate as well as the beats percentages.
This is a significantly better performance than we have seen from these banks in recent quarters.
What is Expected for 2021 Q2 & Beyond?
Looking at Q2 on a blended basis, combining the results that have come out with estimates for the still-to-come companies, total earnings for the S&P 500 index are currently expected to be up +74.3% from the same period last year on +20% higher revenues, with the growth rate steadily going up as companies come out with better-than-expected results. This would follow the +49.3% earnings growth on +10.3% higher revenues in 2021 Q1.
A big part of the unusually strong earnings growth expected in the Q2 earnings season is due to easy comparisons to last year’s Covid-hit period. But as we have been consistently pointing out, not all of the growth is a result of easy comparisons.
Given how strong earnings surprises turned out to be in the preceding reporting cycle (2021 Q1) and the numbers out already, the final earnings growth tally for 2021 Q2 could be easily north of +80%.
The chart below takes a big-picture view of the quarterly earnings and revenue growth pace.
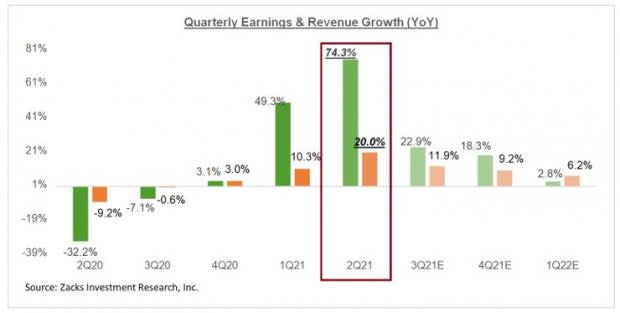
Image Source: Zacks Investment Research
The chart below shows the aggregate bottom-up quarterly earnings tallies, actual earnings for the reported periods and estimates for 2021 Q2 and beyond, to give us a better sense of the easy-comps question.
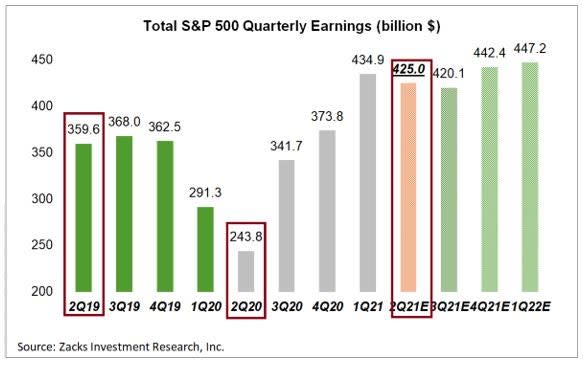
Image Source: Zacks Investment Research
As you can see here, 2021 Q2 at $425 billion is +69% above the Covid-hit $243.8 billion tally achieved in 2020 Q2. You can also see here that 2021 Q2 is +18.2% above the comparable pre-Covid 2019 period.
The chart below presents the big-picture view on an annual basis. As you can see below, 2021 earnings and revenues are expected to be up +37.4% and +11.2%, respectively, which follows the Covid-driven decline of -13.1% in 2020.
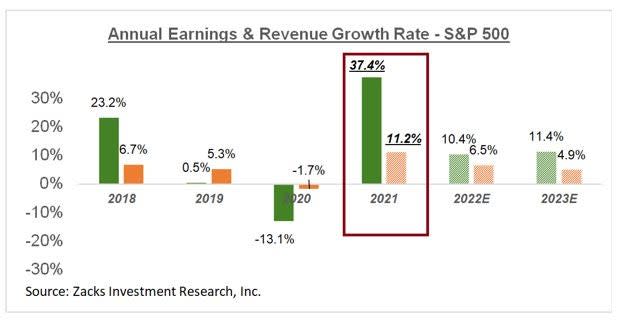
Image Source: Zacks Investment Research
Please note the double-digit earnings growth expected in each of the next two years. This suggests that the market isn’t looking for a one-off rebound this year, but rather an enduring growth cycle that continues over the next couple of years.
To the extent that this growth outlook can improve as we move into the back half of 2021 will determine whether the overall earnings picture is getting better or leveling off.
For a detailed look at the overall earnings picture, including expectations for the coming periods, please check out our weekly Earnings Trends report >>>>All-Around Earnings Strength
Want the latest recommendations from Zacks Investment Research? Today, you can download 7 Best Stocks for the Next 30 Days. Click to get this free report
Amazon.com, Inc. (AMZN) : Free Stock Analysis Report
Apple Inc. (AAPL) : Free Stock Analysis Report
Microsoft Corporation (MSFT) : Free Stock Analysis Report
Tesla, Inc. (TSLA) : Free Stock Analysis Report
Facebook, Inc. (FB) : Free Stock Analysis Report
Twitter, Inc. (TWTR) : Free Stock Analysis Report
Snap Inc. (SNAP) : Free Stock Analysis Report
Spotify Technology SA (SPOT) : Free Stock Analysis Report
To read this article on Zacks.com click here.
Zacks Investment Research
